Systems · DGX Spark
Optimizing throughput for async RL
What I learned serving DeepSeek-V4-Flash for RL rollouts on two DGX Spark machines.
When DeepSeek-V4-Flash and DeepSpec landed, I wanted to see how far I could push the hardware I had on hand. I had 2 DGX Spark machines and wanted to use them for RL experiments without renting cloud compute. Before connecting a trainer, I needed to know how quickly they could serve a 284B-parameter MoE and what would limit the rollout engine as I gave it more work.
Generation is often the slowest part of reasoning and agentic RL. A single trajectory can run through many model calls, tool results, and retrieval steps before it produces a training signal. If the learner is waiting on those trajectories, faster inference gives it more useful work to train on in the same amount of time. I wanted to find the serving ceiling first, then understand what would change once the policy was learning.
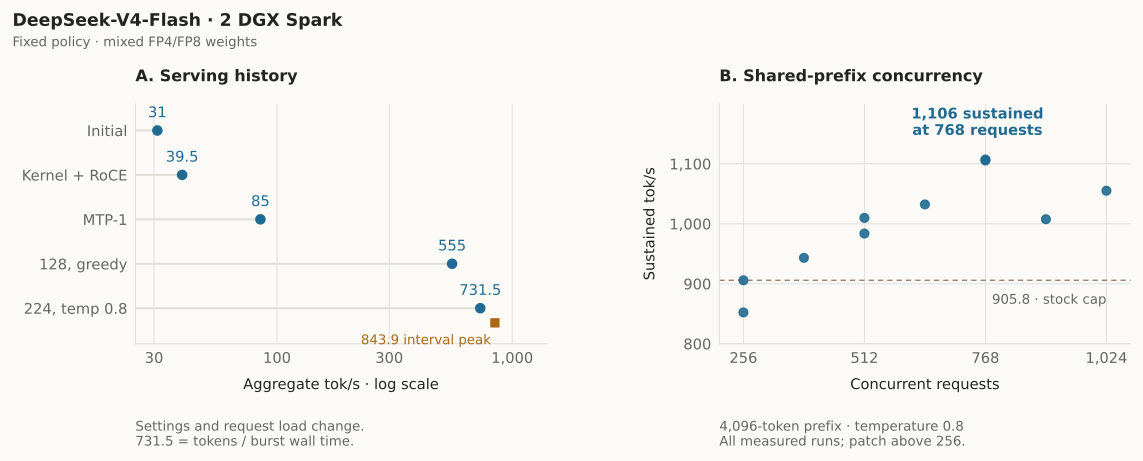
The first configuration that served reached 31 tokens per second in aggregate. After tuning the kernel, network, speculative decoding, and concurrency, I reached 731.5 sustained. A later workspace fix let a shared-prefix workload scale to about 1,106 sustained tokens per second. The interesting part was finding out which limits belonged to the hardware and which ones I had inherited from the serving stack.
- Why I started with rollout throughput
- Thinking about hardware
- The serving levers
- Concurrency and the speculative-decoding surprise
- Shared prompts and prefix caching
- Patch the decode workspace
- Adding DSpark
- Prompt-lookup drafting
- The recipe
- What changes when the trainer is live

Figure 1. The serving changes I tried (A), followed by the shared-prefix concurrency sweep (B). The two panels use different workloads. Full-size figure.
Why I started with rollout throughput
I think about learning speed as effectiveness times throughput. Effectiveness is how much useful learning signal each rollout provides. Throughput is how much rollout and training work the system completes per unit time. On a fixed compute budget, I wanted to improve the second term without giving up the first.
That is what made speculative decoding worth trying. A small draft head proposes tokens, and the target model verifies them. With exact rejection sampling, the output follows the target’s distribution, so a successful draft can save target passes without changing the samples the learner receives.
NVIDIA’s NeMo-RL report studies this in RL post-training, including how much of the generation time remains on the critical path once training and sampling overlap. I was measuring a fixed-policy server here; connecting the trainer would tell me how much of the serving gain the full loop could use.
Thinking about hardware
Each Spark has plenty of memory for a small machine, but the model’s 149 GB of weights won’t fit in one. I split them across both machines with tensor parallelism, leaving about 75 GB of weights on each and the remaining memory for KV cache and activations.
| Constraint | This experiment |
|---|---|
| Hardware | 2 DGX Spark machines, GB10 (SM121), 128 GB unified memory each |
| Memory bandwidth | 273 GB/s per machine, the advertised hardware bandwidth |
| Interconnect | 200 GbE RoCE, with NCCL transport verified in the logs |
| Target | DeepSeek-V4-Flash, 284B total / about 13B active parameters per token |
| Weights | About 149 GB, native mixed FP4/FP8, tensor parallelism across both machines |
| Context limit | 128k, leaving more memory for concurrent requests than a 1M limit |
| Sampling | Greedy during early tuning; temperature 0.8 in the rollout comparisons |
The CPU and GPU share the same memory pool. More concurrent sequences consume more KV cache, and tensor parallelism adds a cross-machine exchange to each decode step. Those two constraints made concurrency and the network part of the same problem.
I expected weight movement to be expensive on GB10. Batching lets several tokens reuse expert weights, although the actual traffic depends on which experts the batch selects. At some point, the extra attention and scheduling work has to catch up. I used that picture to decide what to try, rather than treating the advertised 273 GB/s as a bandwidth measurement from the run.
My best single-stream configuration reached 38.3 tokens per second. To produce more rollout data, I needed to get more sequences through the server at once.
The serving levers
Table 1. Throughput as I tuned the server. The early rows change the per-token path; the later rows increase request load and change temperature. Table 2 holds those settings fixed to compare speculation on and off.
| Stage | Single stream (tok/s) | Aggregate (tok/s) |
|---|---|---|
| Initial serving | 12.6 | 31 |
| GB10 MoE kernel + RoCE | 18.7 | 39.5 |
| MTP-1 draft head | 33.4 | 85 |
| 128 requests, greedy | — | 555 |
| 224 requests, temperature 0.8 | — | 731.5 sustained |
Single-stream speed tells me how quickly one trajectory advances. Aggregate throughput tells me how much data the server produces when I have enough independent rollouts to keep it busy. I needed both measurements to decide which settings were useful.
Fit the model with tensor parallelism
In vLLM, I run a 2-node job with --tensor-parallel-size 2 and --nnodes 2. One Spark runs the API server; the other runs headless as a worker.
This was the first configuration that served. It reached 12.6 tok/s single-stream and 31 aggregate. Every later stage used the same target checkpoint.
Make the MoE kernel match the chip
Once the model served, I started with the expert matrix multiplications. Each MoE layer routes tokens to experts, runs their matmuls, then gathers the outputs. I wanted to know whether vLLM was using the best available implementation of that path on GB10.
vLLM picks its MoE kernel automatically. On GB10 it picked MARLIN, a general fallback. The serving image also has a GB10-specific B12X path. One environment variable switches it on, VLLM_USE_B12X_MOE=1.
B12X runs the same expert operations through a different GPU kernel. On a new chip, it is worth checking that choice before tuning higher-level settings; getting the model to load does not tell you which path it took.
B12X alone did not show the full gain because tensor parallelism made the network part of every token. Over a TCP socket, the faster expert kernel waited on communication.
Move cross-node traffic onto RoCE
The faster expert kernel barely moved aggregate throughput while traffic was still running over a plain TCP socket. With tensor parallelism, both machines exchange activations on every decode step. Reducing the matmul time was only useful if I also reduced the time spent waiting for that exchange.
The 2 machines have a 200 GbE RoCE link for this.RoCE is RDMA over Converged Ethernet. NCCL is NVIDIA’s communication library for multi-GPU and multi-node jobs. NCCL can use that RDMA transport instead of falling back to a TCP socket.
On GB10, GPU Direct RDMA Disabled in the logs is expected.GPUDirect-RDMA lets a network adapter access GPU memory directly on systems that support it. GB10 can still benefit from RoCE transport even when GPUDirect-RDMA is disabled. The win is the RoCE transport path, not GPUDirect-RDMA.
With B12X and RoCE enabled, the pair reached 39.5 tokens per second in aggregate, up from 31 in the initial configuration.
I first bind-mounted /dev/infiniband into the container. The device files appeared where I expected them, so it looked as though the transport was configured correctly. RoCE also needs each RDMA device passed with --device, plus --cap-add=IPC_LOCK.
Docker’s device cgroup still blocks the process from opening them.A device cgroup controls which host devices a container process may open. A bind mount can show the files without granting permission to use them. NCCL falls back to TCP, and the model keeps generating, so there is no serving error to point you toward the network.
I had to read the NCCL log and confirm that it named the RoCE HCA. No device found meant the container still could not use it. A working GB10 run could still print GPU Direct RDMA Disabled, which made that distinction easy to miss.
Use the model’s draft head
Now the model fits, the expert kernel matches the chip and the cross-node link is on RoCE. The remaining per-token question is speculative decoding.
DeepSeek-V4-Flash has one multi-token-prediction layer built in. I use it as the draft head. With speculative decoding on, that head proposes future tokens. The main model verifies them in one pass.
Drafting and verification add work. They pay off when enough proposed tokens are accepted to avoid later target passes. The question is how many tokens the draft head should propose.
I swept k, the number of proposed tokens, over 1, 2 and 3. In this sweep, acceptance fell with draft position. The first proposed token is accepted about 79% of the time, the second 48%, the third 16%.
The best choice depended on what I was measuring. k=2 gave the lowest single-stream latency, while k=1 gave the best aggregate throughput. The third draft position added verification work for a token that rarely survived, and k=3 lost in the configurations I tested. I kept k=1 for the rollout comparisons.
MTP-1 took single-stream to 33.4 tokens per second. MTP-2 set the single-stream best at 38.3. Aggregate at low concurrency reached 85. At that point, the per-token path stopped being the limiting question. Concurrency became the next lever.
Concurrency and the speculative-decoding surprise
Raise concurrency to the wall
With the per-token path working, I raised concurrency to find out how much rollout work the machines could hold before either throughput stopped improving or the server failed.
Two settings mattered. I set --max-num-batched-tokens 8192, because the speculative-decoding default of 2048 starves the batch. I set --gpu-memory-utilization 0.9 to give KV cache room.
I served at 128k context, not the model’s full 1M. That choice left memory for more concurrent sequences.
Past 256 sequences, the SM120 decode kernel crashes in _get_decode_scratch. It reserves a 289 MB workspace, then asks for more and hits a lock. At the time I read that as a hard kernel limit and capped concurrency at 256.
At 128 sequences with greedy decoding, aggregate throughput reached 555 tokens per second.
Re-decide at the temperature you train at
Every number so far used greedy decoding. I wanted to sample rollouts at temperature 0.8, so I repeated the speculation-on/off comparison at both sequence caps. The draft needed to pay for itself under those sampling conditions.
Table 2. Speculative decoding at temperature 0.8. The server caps were 128 and 256 sequences; client bursts contained 160 and 224 requests, respectively, with up to 512 output tokens per request. Sustained throughput is total output tokens divided by burst wall time. Peak is the largest generation-throughput interval reported in the server log.
| Sequence cap | Speculative decoding | Sustained (tok/s) | Peak (tok/s) | Mean accepted length |
|---|---|---|---|---|
| 256 | MTP-1 | 731.5 | 843.9 | 1.81 |
| 256 | off | 587.9 | 662.4 | - |
| 128 | MTP-1 | 434.9 | 590.4 | 1.79 |
| 128 | off | 339.1 | 498.8 | - |
Speculative decoding wins at both sequence caps. At the 256-sequence cap it adds 24% sustained and 27% peak. At the 128-sequence cap it adds 28% sustained and 18% peak.
This is the result I did not expect. I thought verification would become too expensive at higher concurrency, but MTP-1 still improved sustained throughput at both caps. My guess is that reusing weights left enough room for the extra verification work. I would need kernel-level measurements to separate that from other batching effects. Either way, turning speculation off because the batch was large would have cost throughput on this setup.
Shared prompts and prefix caching
The first sweep sent a different short prompt to every request. For group-based RL, I also needed to sample several completions from the same prompt. Those requests can share a long system prompt, tool schemas, and task context, giving the server prefix blocks it can compute once and reuse.
I re-ran the temp-0.8 comparison on a shared-prompt workload, one shared agent prompt of about 1,100 tokens, 224 completions, the same winning config, prefix caching on versus off.
Table 3. Prefix caching on a shared-prompt rollout workload. Same prompt, same completions, caching toggled.
| Prefix caching | GPU cache hit | Sustained (tok/s) |
|---|---|---|
| on | 77.7% | 495.7 |
| off | 0% | 311.1 |
Prefix caching lands a 77.7% hit and 1.6x sustained throughput, 495.7 against 311.1 tokens per second. Without caching, every completion recomputes the 1,100-token prompt. With caching, later requests can reuse cached prefix blocks.
Patch the decode workspace
The 256-sequence cap set the aggregate ceiling, so before accepting it I wanted to know what the kernel was hitting.
The serving image includes 4 optional GB10-specific code paths, all disabled by default. They are a faster FP8 GEMM for the dense projections, a fused output projection, a sparse-attention indexer and a multi-head path. I turned each on at the winning config to see what moved. The output projection gained 1.4%, inside the run-to-run noise. The sparse indexer cost 3%. The FP8 GEMM and the multi-head path crashed at load.
Those trials left me with the same concurrency limit, so I went back to the crash instead of continuing to tune around it.
AssertionError: Workspace is locked but allocation from
'sm120.py:_get_decode_scratch' requires 325.27 MB,
current size is 289.12 MB.
Workspace growth is not allowed after locking.
vLLM sizes a scratch workspace during warmup, then locks it so the CUDA graphs see stable allocations. The decode scratch grows with concurrency, and warmup had locked it at the 256-sequence size of 289 MB. At 288 sequences the kernel asked for 325 MB and hit the lock, 36 MB short with about 45 GB of memory free. A warmup helper had reserved the workspace for 64 tokens, the count it uses to pick the small-batch kernel, instead of the concurrency the server runs at.
The patch reserves the workspace for the concurrency you serve, behind an environment variable so the default stays as it was. It is 12 lines, and it changes a buffer size rather than any math.
With the workspace sized for the concurrency, throughput climbs past 256. On the shared-prompt workload at a 4,096-token prefix, the cap had held 905.8 tokens per second. The best sustained throughput was about 1,106 tok/s at 768 concurrent requests, 22% higher. Throughput fell at 896 and 1,024 requests. For this workload, 768 was the best operating point tested.
The sweep logs record the individual runs below, including the server-cap changes between stages.
| Concurrent requests | Sustained tok/s |
|---|---|
| 256, stock kernel | 905.8 |
| 256, patched | 852.2 |
| 384 | 943.2 |
| 512 | 983.7, 1,009.8 |
| 640 | 1,032.3 |
| 768 | 1,105.5, 1,107.2 |
| 896 | 1,007.6 |
| 1,024 | 1,055.1 |
I checked teacher-forced token distributions at 59,560 positions across 384 prompts. Median KL divergence was 0.0051 between unpatched and patched runs, versus 0.0058 between two unpatched runs. Top-1 agreement was 95.2% and 94.7%, respectively. The patch comparison stayed within the observed repeat-run variation.
I validated the patch at 128k context. At 262k the decode path fails a new way, a workspace assertion on the first request that a larger reservation does not fix. Longer contexts need their own debugging pass.
Adding DSpark
I also tried DSpark, a block-drafting method released with DeepSpec. A draft proposes several positions before the target verifies them. I wanted to know whether that larger block would outperform the built-in MTP head.
Running it on GB10 was the first problem. The vLLM build I started from disabled the sparse-MLA backend on SM121, and the community overlay targeted x86 RTX Pro rather than aarch64 GB10. So I ported the drafter onto the working GB10 image. Serving it took disabling the FlashInfer autotuner, whose per-rank trial count desynced the ranks, and fixing a base vLLM decode-split bug that only parallel-drafting methods hit.
Once it served, I compared it with MTP-1 at the same concurrency, with CUDA graphs enabled. The overlay verifies a fixed block and omits DSpark’s confidence-based scheduling. I also did not retain a pinned draft-checkpoint revision, which limits how closely I can compare this run with DeepSeek’s published results.
Table 4. DSpark against MTP-1, with CUDA graphs, at 224 concurrent requests. Sustained tokens per second, with mean accepted length in parentheses.
| Workload | MTP-1 | DSpark k=4 |
|---|---|---|
| Distinct-prompt | 748 (1.80) | 418 (1.66) |
| Shared 1,100 prefix | 512 (1.90) | 400 (2.05) |
| Shared 4,096 prefix | 512 (1.90) | 417 (2.07) |
DSpark ran 19 to 44% slower than MTP-1 across these workloads. Its mean accepted length was 1.7 to 2.1, while k=4 required the target to verify 5 positions per step against MTP-1’s 2. The additional accepted tokens did not repay the draft and verification work in this configuration.
CUDA graphs did not change the result; graphed and eager DSpark both measured 418 tok/s. I tried k=2 to reduce the verification work, but that hung the multi-node draft-sample path. With the configurations I could get running, I stayed with MTP-1.
Prompt-lookup drafting
I also tried vLLM’s ngram speculative decoding. It looks for the last few generated tokens in the context and proposes the tokens that followed a previous match. That makes it a cheap drafter to try on completions that reuse text from the prompt.
Table 5. Prompt-lookup ngram against MTP-1 at temperature 0.8. Sustained throughput in tok/s. The MTP-1 range spans the serving configurations tested; the ngram values are two warm-burst runs. The rebuilt harness differs from the earlier tables. Shared bursts contain 768 requests over a synthetic 3,363-token prefix constructed by repeating a sentence 90 times.
| Workload | MTP-1 | ngram k=3 |
|---|---|---|
| Distinct-prompt | 714 to 761 | 518 |
| Shared prompt, warm | 784 to 931 | 949 and 976 |
The warm-burst logs record throughput but not accepted length. On distinct prompts, ngram’s mean accepted length was 1.86 versus about 1.8 for MTP-1, despite its lower throughput.
Both warm ngram runs exceeded the best MTP-1 configuration in this sweep, while the short distinct prompts favored MTP-1. Repeating the same sentence 90 times gives prompt lookup plenty of text to match, so I’d want to try actual rollout traces before choosing it for the trainer. It has no learned draft weights to keep in sync, though its acceptance can still change as the policy produces different text.Breaking Entropy Bounds studies MTP acceptance during RL and finds that suitable offline draft training with probabilistic rejection sampling can maintain acceptance without online draft updates.
The recipe
The runnable scripts are in inference-recipes/inference, alongside the image settings and benchmark logs. The flags below describe the configuration I measured; check the repo before launching, since its serving defaults have changed since the original sweep.
You need 2 DGX Spark machines on a working RoCE link. You also need the official deepseek-ai/DeepSeek-V4-Flash checkpoint on both machines and a GB10 vLLM image with the B12X MoE path. The repo README lists the rest.
Find your network values
RoCE is the easiest thing to get silently wrong, so confirm your values first. Run preflight.sh on each machine before launch. It prints the values you need.
ibv_devices        # the RDMA device name          -> ROCE_HCA
rdma link show     # device-to-netdev, link state   -> NET_IF
show_gids          # the GID table; the RoCE v2 row -> GID_INDEX
ls /dev/infiniband # the devices passed into the container
The settings that matter
I would keep the network checks when moving to another model, then re-test the kernel, cache, and memory settings for that checkpoint.
| Setting | Value | Scope | Why it matters |
|---|---|---|---|
VLLM_USE_B12X_MOE |
1 | build | use the GB10 MoE kernel, not the MARLIN fallback |
RDMA --device and --cap-add=IPC_LOCK |
pass through | build | let NCCL open the RoCE devices inside Docker |
NCCL_IB_HCA, NCCL_IB_GID_INDEX |
your HCA, the v2 GID | build | point NCCL at the RoCE device |
--tensor-parallel-size, --nnodes |
2, 2 | build | split 149 GB of weights across both machines |
--max-num-seqs |
256 stock / 768 patched | build | the workspace fix is required above the stock limit |
--max-num-batched-tokens |
8192 | build | the setting used in this comparison; the companion defaults have since changed |
--kv-cache-dtype, --block-size, --gpu-memory-utilization |
fp8, 256, 0.9 | build | leave enough unified memory for KV cache |
--enable-prefix-caching |
on | build | reuse a shared prompt prefix across a rollout group |
IMAGE, MODEL_DIR, --served-model-name |
the model files | model | the model and its GB10 serving build |
--tokenizer-mode |
deepseek_v4 | model | the model’s tokenizer implementation |
--speculative-config |
mtp, k=1 | model | use the draft head; k=1 wins aggregate |
VLLM_SPARSE_INDEXER_MAX_LOGITS_MB |
256 | model | V4 hybrid attention only |
Run it
git clone https://github.com/jbarnes850/inference-recipes
cd inference-recipes/inference
cp config.env.example config.env   # edit for your machines
./preflight.sh                     # print RoCE values; repeat on the worker
./up.sh                            # launch both nodes, ~5 min cold start
MAX_NUM_BATCHED_TOKENS=8192 ./rl_sweep.sh  # run the reported temp-0.8 comparison
./down.sh                          # stop and free the machines when done
Cold start took about 5 minutes, mostly reading weights from disk. The server held about 120 GB on each machine even while idle.
What changes when the trainer is live
The next step was to connect a trainer that updates the policy while the server runs. That changes the assumptions behind the serving measurements, because the draft head and the target can move out of agreement.
Recent open-weight systems lean on asynchronous generationAsynchronous generation means the sampler keeps producing rollouts while training continues. The learner may train on slightly stale samples, but the hardware spends less time idle. to keep the sampler busy while the learner trains. Luke Huang’s survey of frontier async RL maps that pattern.
Draft acceptance can change
The distinct-prompt sweep used the model’s frozen MTP head against the base policy. During RL, changes to the policy can reduce its agreement with that head.
I would watch mean accepted length and repeat the speculation-on/off timing comparison as the policy changes. A drop in acceptance matters only in relation to what drafting and verification cost at that point in the run.
NVIDIA’s report trains the drafter against the changing policy with a separate supervision loss, then sends those updated draft weights to the rollout engine. That is more work than copying the same frozen head at each resync, and whether it pays depends on how well the existing draft stays aligned.
Individual trajectories need latency measurements
The high-concurrency results are useful when the trainer has enough independent rollouts to keep the server full. A long multi-turn trajectory still has to finish each model call before it can take the next action. For a small number of those trajectories, I would lower concurrency and measure their completion time directly rather than choose the setting with the highest aggregate tokens per second.
Weights have to hot-swap
vLLM supports this through an in-place weight update, with the engine briefly paused rather than restarted. That update path has to include the MTP head.
Getting the server through a sweep answered the first question. The next recipe connects the sampler to a live trainer, using Qwen3-4B on one Spark and vLLM on the other. That smaller model leaves room to investigate how the learner, trajectories, and weight sync behave together.