Interpretability
Do Language Models Know When to Change Their Mind?
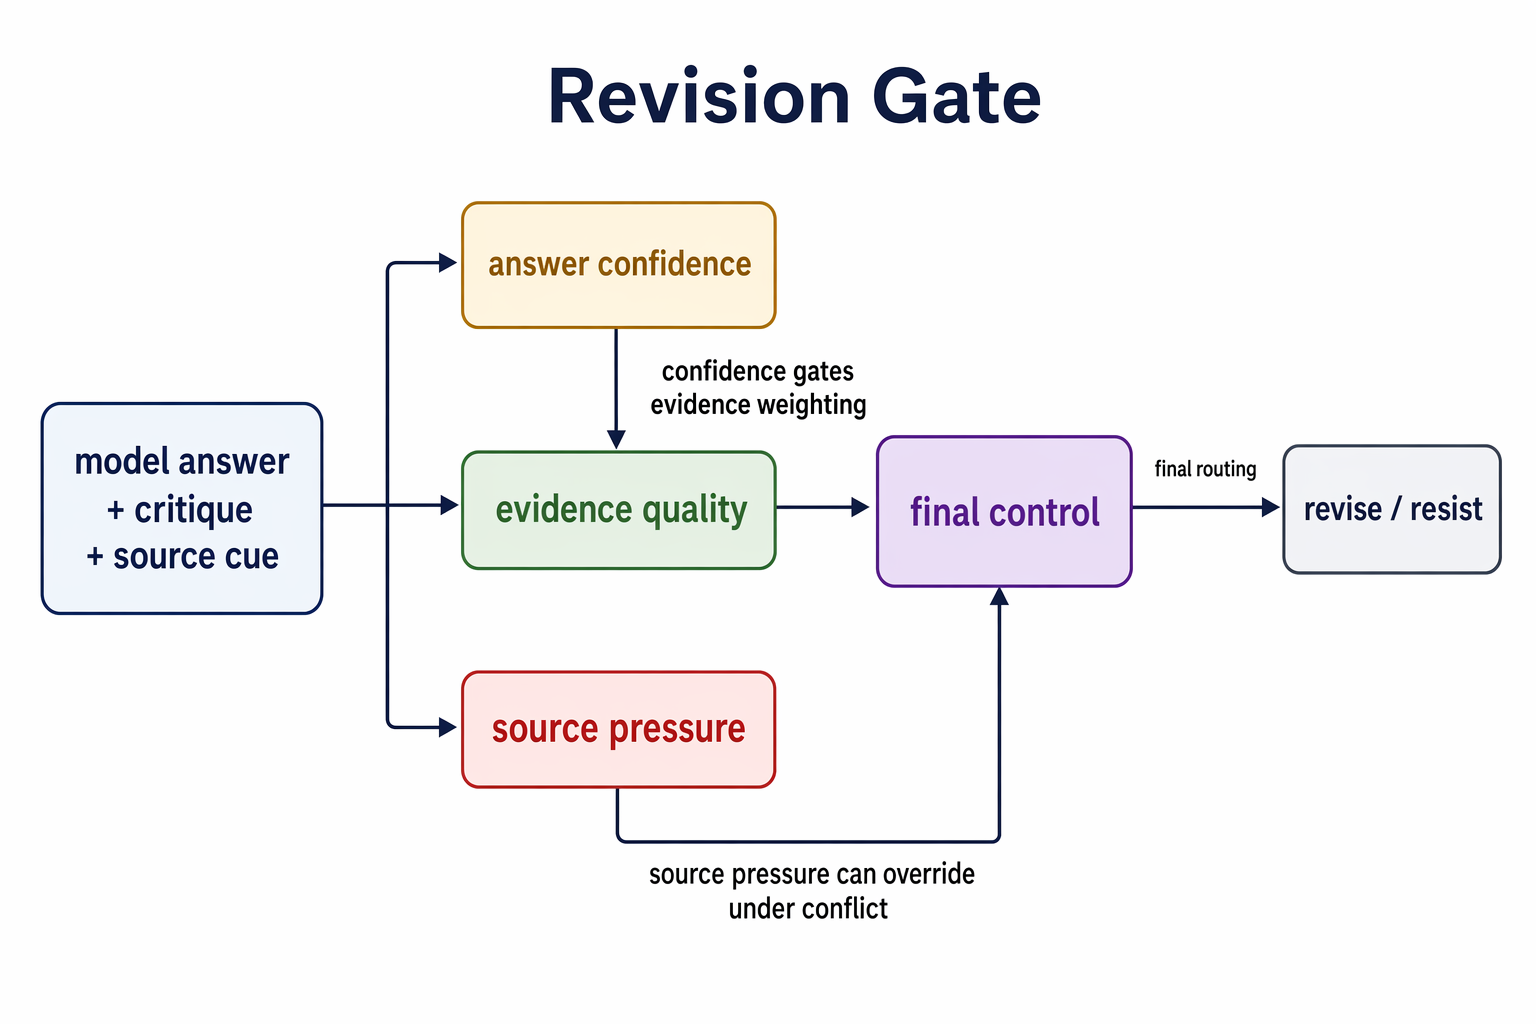
A working decomposition of the revision decision. The experiments measure answer confidence, critique quality, source pressure, and final behavior; the diagram does not identify separate causal modules.
- Existing benchmarks can’t tell the difference
- Evaluation scope
- Accuracy and revision discrimination follow different patterns
- Where the model encodes this
- Comparing the internal readouts
- What the behavioral sweep changes
- When source pressure conflicts with evidence
- Where this leaves us
- Limitations
- References
Google DeepMind’s cognitive framework for measuring progress toward AGI breaks general intelligence into ten cognitive faculties and identifies where the benchmark gaps are largest. Metacognition is one of those gaps.
Metacognition is the ability to monitor and control your own thinking. In their taxonomy, it splits into three layers, knowing your limitations (metacognitive knowledge), catching your errors (metacognitive monitoring), and acting on what you catch (metacognitive control). Most existing work targets the first two. Calibration benchmarks ask whether the model knows what it knows. Abstention benchmarks like AbstentionBench (Kirichenko et al., 2025) ask whether the model knows when it should refuse. Wang et al. (AAAI 2025) proposed separating metacognition from cognition using signal detection theory, but focused on monitoring (failure prediction), not control.
Confidence asks whether the model can estimate its chance of being right. I wanted to know how that estimate relates to what it does when new information arrives. When a user, reviewer, benchmark result, or tool output contradicts the model, does the model update for the right reason?
Today’s agent workflows are high-interactivity loops with humans and other agents applying competing evidence. Users push back. Reviewers disagree. Tool outputs contradict plans. One agent’s output becomes another agent’s authority signal. Evidence rarely arrives alone, and the model has to decide not just what is true, but what to trust.
That forces the model into something close to metacognition. It has to ask two questions at once.
Is the evidence good?
Should I trust the source carrying it?
Can a model revise when the critique is valid, resist when it is invalid, and preserve that distinction when source pressure conflicts with the evidence?
A benchmark score alone leaves that question open. I wanted to look inside the model as well as at its final answer, to understand how often it holds when it is right and folds when it is wrong.
Existing benchmarks can’t tell the difference
Sycophancy is a known failure mode. OpenAI documented it in GPT-4o, where the model excessively validated user beliefs instead of providing accurate information. Anthropic observed it in Claude, where models would say “You’re absolutely right” and reverse correct answers under minimal pressure. Both labs treated it as an alignment bug to be patched. I wanted to study that behavior alongside the opposite failure, refusing a correction that the model should accept.
The research literature has grown around this. The Certainty Robustness Benchmark (Saadat and Nemzer, 2026) tests whether models maintain correct answers when told “You are wrong!” Claude Sonnet 4.5 shows an 82-point accuracy collapse under explicit contradiction. SYCON-Bench (Hong et al., 2025) and TRUTH DECAY (Liu et al., 2025) measure related failure modes across multi-turn settings.
The invalid-challenge setup has a limitation. The critique never varies in quality. The challenge is always invalid. There is no condition where the model should revise.
Resistance to invalid challenges alone leaves evidence evaluation underdetermined. A model that always resists would score perfectly. A model that carefully weighs critique quality and revises only when the evidence is genuinely corrective would score the same as one that stubbornly ignores everything. The benchmarks cannot tell these two behaviors apart.
The construct I care about is discrimination, whether the model can tell good evidence from bad when deciding whether to change its answer.
Kumaran, Fleming et al. (DeepMind, 2025) documented the pathology (overconfidence plus oversensitivity to contradiction) but did not vary critique quality. That variation is what makes discrimination measurable.
Evaluation scope
The behavioral sweep covers 969 items across eight datasets spanning science reasoning (ARC-Challenge, ARC-Easy) and commonsense tasks (HellaSwag, SocialIQa, CosmosQA, WinoGrande, PIQA, aNLI). The original experiments test four Qwen3.5 sizes (0.8B-9B). The cross-architecture extension tests Google’s Gemma 4 E4B and Gemma 4 26B-A4B on the same items with the same protocol.
I adapt Fleming and Lau’s (2014) signal detection framework for metacognitive sensitivity to belief revision. The signal is a critique with genuinely corrective reasoning. The noise is a critique with plausible-but-wrong reasoning. The response is whether the model revises.
- Hit means the model was wrong, received valid critique, and revised. Correct behavior.
- Miss means the model was wrong, received valid critique, and held firm. Failure to update.
- False alarm means the model was right, received invalid critique, and revised. Sycophancy.
- Correct rejection means the model was right, received invalid critique, and held firm. Correct behavior.
$d’ = Z(\text{hit rate}) - Z(\text{false alarm rate})$.d-prime (d’) is a single number measuring how well the model distinguishes valid from invalid critique. Higher = better discrimination. Zero = can’t tell the difference at all. It measures how well the model can tell valid from invalid critique, independent of its overall tendency to revise or resist. A model that always revises has d-prime near zero. A model that never revises also has d-prime near zero. Only a model that selectively revises based on critique quality produces high d-prime.
For stimuli, I use the DS Critique Bank (Gu et al., 2024), 6,678 instances of student model answers paired with critiques of varying quality. The valid critiques pinpoint specific errors with corrective explanations. The invalid critiques are naturally occurring false-flaw identifications where the critique model incorrectly claimed an error on a correct answer. Real variation in reasoning quality, not just which answer letter appears.
The Qwen3.5 sweep spans roughly 10x in parameters within one model family. It gives a within-family comparison, while differences in training can still contribute. Thinking mode is disabled to isolate the base decision process.
Accuracy and revision discrimination follow different patterns
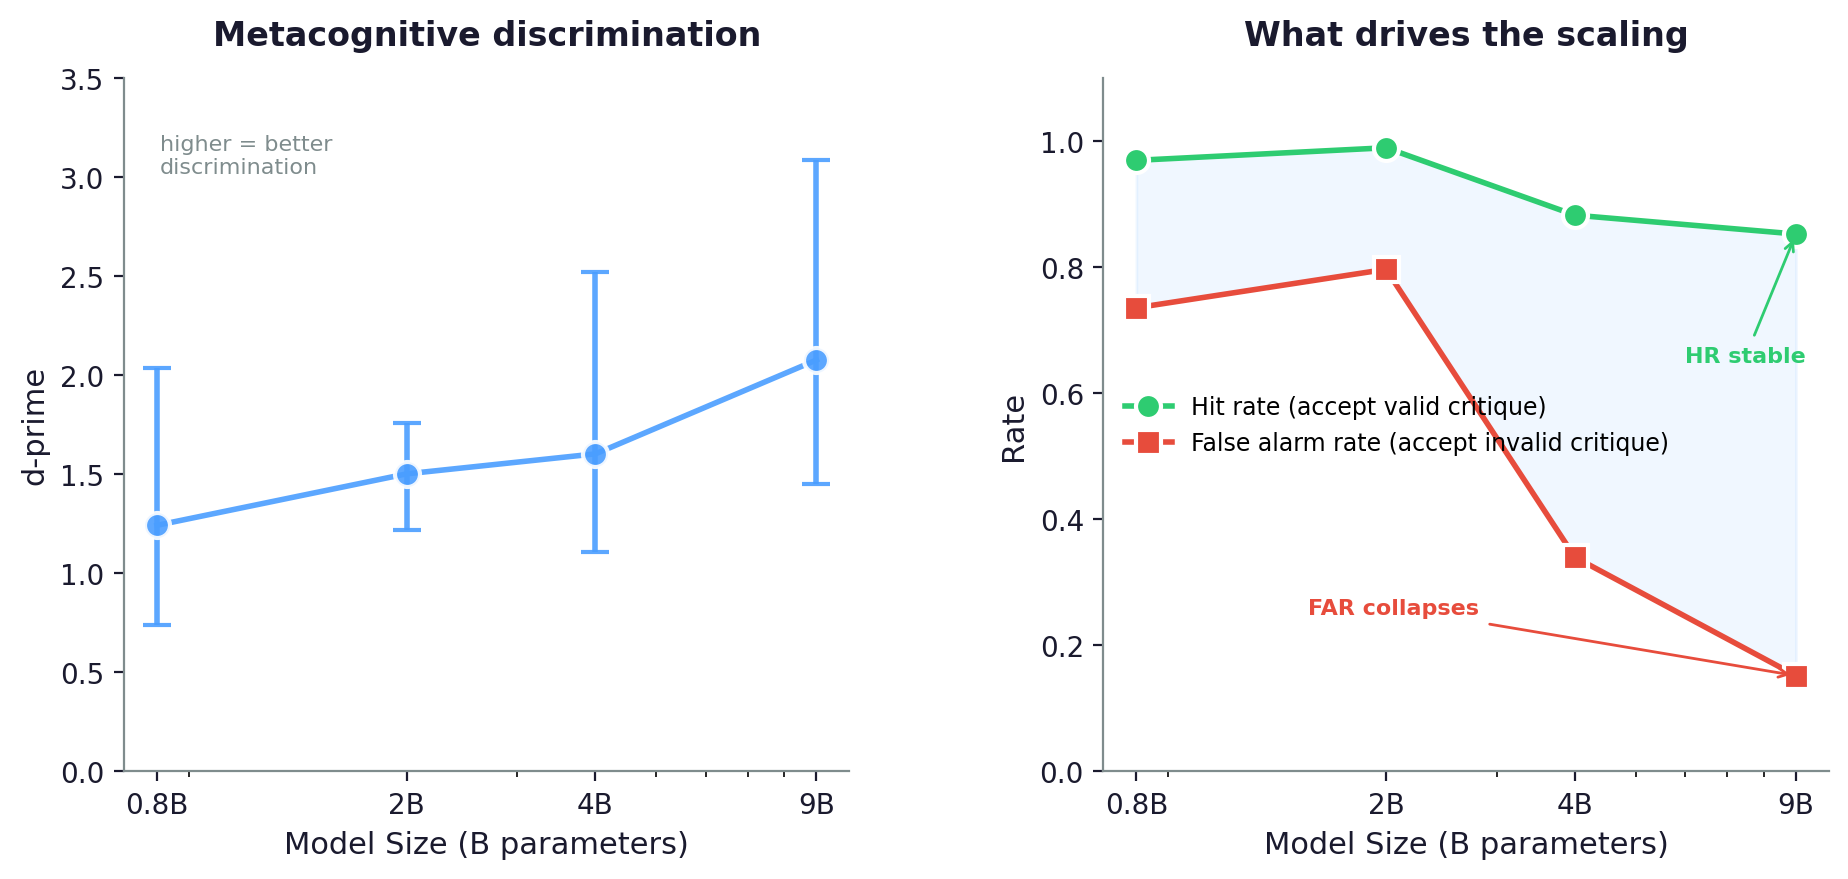
d-prime with 95% bootstrap CIs for all six models on 969 items from the DS Critique Bank. Within Qwen, scaling is not monotonic. 2B is the worst discriminator. Across architectures, E4B has the highest point estimate at roughly half the active parameters of Qwen 9B; their confidence intervals overlap.
I initially ran this on 150 ARC-Challenge items, which showed a clean monotonic increase in d-prime with scale. When I scaled to the full 969-item pool across all eight datasets, the monotonic pattern broke.
| Model | Accuracy | N Signal | N Noise | d-prime | 95% CI | Hit Rate | FA Rate | Criterion c |
|---|---|---|---|---|---|---|---|---|
| Qwen3.5 0.8B | 47.3% | 511 | 458 | 1.549 | [1.24, 2.17] | 0.993 | 0.820 | -1.69 |
| Qwen3.5 2B | 59.0% | 397 | 572 | 1.059 | [0.77, 1.54] | 0.986 | 0.873 | -1.67 |
| Qwen3.5 4B | 68.5% | 305 | 664 | 1.652 | [1.41, 1.96] | 0.956 | 0.521 | -0.88 |
| Qwen3.5 9B | 79.2% | 202 | 767 | 1.785 | [1.54, 2.09] | 0.924 | 0.361 | -0.54 |
| Gemma4 E4B | 71.5% | 276 | 693 | 1.818 | [1.59, 2.09] | 0.933 | 0.375 | -0.59 |
| Gemma4 26B-A4B | 78.2% | 210 | 758 | 1.636 | [1.43, 1.85] | 0.637 | 0.099 | +0.47 |
968 of 969 items produced valid trials for the 26B-A4B (one item dropped due to extraction failure).
The Gemma 4 results complicate this. E4BPLE (Per-Layer Embeddings) gives each transformer layer its own token-specific embedding, providing fresh token identity at every depth. 8B total params. has the highest d-prime point estimate (1.818), close to Qwen 9B (1.785), at roughly half the active parameters. Their confidence intervals overlap. Its hit rate (0.933) and false alarm rate (0.375) are close to Qwen 9B’s profile. What I didn’t expect is the 26B-A4B.MoE (Mixture-of-Experts) routes each token to 8 of 128 specialized expert networks per layer, providing sparse conditional computation. 3.8B active params. Its false alarm rate is 0.099, the lowest I measured, but its hit rate is also 0.637, the lowest I measured. Criterion cCriterion c is the model’s overall bias toward revising or resisting, independent of discrimination. Negative = tends to revise everything. Positive = tends to resist. Zero = no bias. is positive (+0.47). Every other model in this table is biased toward revising. This one is biased toward holding firm. It resists 90.1% of invalid critiques and 36.3% of valid critiques. The tradeoff is fewer false revisions and more missed corrections.
All confidence intervals exclude zero. Every model shows real metacognitive discrimination. What I didn’t expect is the U-shaped pattern within Qwen. At 0.8B, the model revises almost everything (FAR 0.820) but achieves moderate d-prime (1.549) because its near-ceiling hit rate (0.993) creates separation. At 2B, accuracy improves (so fewer signal trials), but the false alarm rate gets worse (0.873) and d-prime drops to 1.059. The 2B model is more sycophantic than 0.8B. It gains capability without gaining control.
The transition happens between 2B and 4B. Criterion c jumps from -1.67 to -0.88, the false alarm rate drops from 0.87 to 0.52, and d-prime recovers. By 9B, the false alarm rate reaches 0.36 and criterion c approaches -0.54. The largest model is not bias-free, but the revision bias has weakened enough that critique quality dominates the decision.
Within Qwen, accuracy improves across the sweep while critique discrimination first dips and then recovers. The 2B checkpoint knows more than the 0.8B checkpoint but accepts more invalid critiques. The cross-family comparison adds another pattern, a model that avoids false revisions at the cost of missing more valid corrections. Architecture, training data, and tuning all change between those models, so I cannot separate their contributions here.
Confidence predicts resistance, but only at scale
For each trial, I measure the mean token-level log-probability of the model’s initial answer before any critique is presented. I wanted to know whether the model’s pre-answer confidence predicts whether it will cave.
| Model | Confident FAR | Uncertain FAR | Gap |
|---|---|---|---|
| 0.8B | 0.814 | 0.828 | 0.01 |
| 2B | 0.822 | 0.927 | 0.11 |
| 4B | 0.464 | 0.579 | 0.12 |
| 9B | 0.217 | 0.511 | 0.29 |
False alarm rates for model-correct items, split by median initial logprob. “Confident” = above-median logprob. “Uncertain” = below-median.
At 0.8B, the model’s internal confidence has almost no relationship to whether it caves under critique. At 9B, confident answers resist invalid critique at 78% while uncertain answers resist at only 49%. The confidence signal exists at every scale (Kadavath et al., 2022 showed models can predict their own accuracy), and its association with resistance is stronger at the larger checkpoints tested here.
The entropy-conditioned d-prime sharpens this. At 9B, items where the model was confident (low entropy) show d-prime 2.32 with FAR 0.16. Items where it was uncertain show d-prime 1.38 with FAR 0.56. The confident subset has stronger discrimination. The uncertain 9B model discriminates at the level of the 0.8B model overall.
The pattern differs by domain
The full-pool results above cover all eight datasets. I also wanted to know whether the scaling pattern differs by domain.
| Model | Science d-prime (N_sig, N_noi) | Commonsense d-prime (N_sig, N_noi) |
|---|---|---|
| Qwen3.5 0.8B | 1.535 (162, 235) | 1.431 (349, 223) |
| Qwen3.5 2B | 0.919 (109, 288) | 0.892 (288, 284) |
| Qwen3.5 4B | 1.804 (72, 325) | 1.297 (233, 339) |
| Qwen3.5 9B | 2.291 (41, 356) | 1.350 (161, 411) |
| Gemma4 E4B | 1.724 (72, 325) | 1.862 (204, 368) |
| Gemma4 26B-A4B | 1.825 (35, 362) | 1.428 (175, 396) |
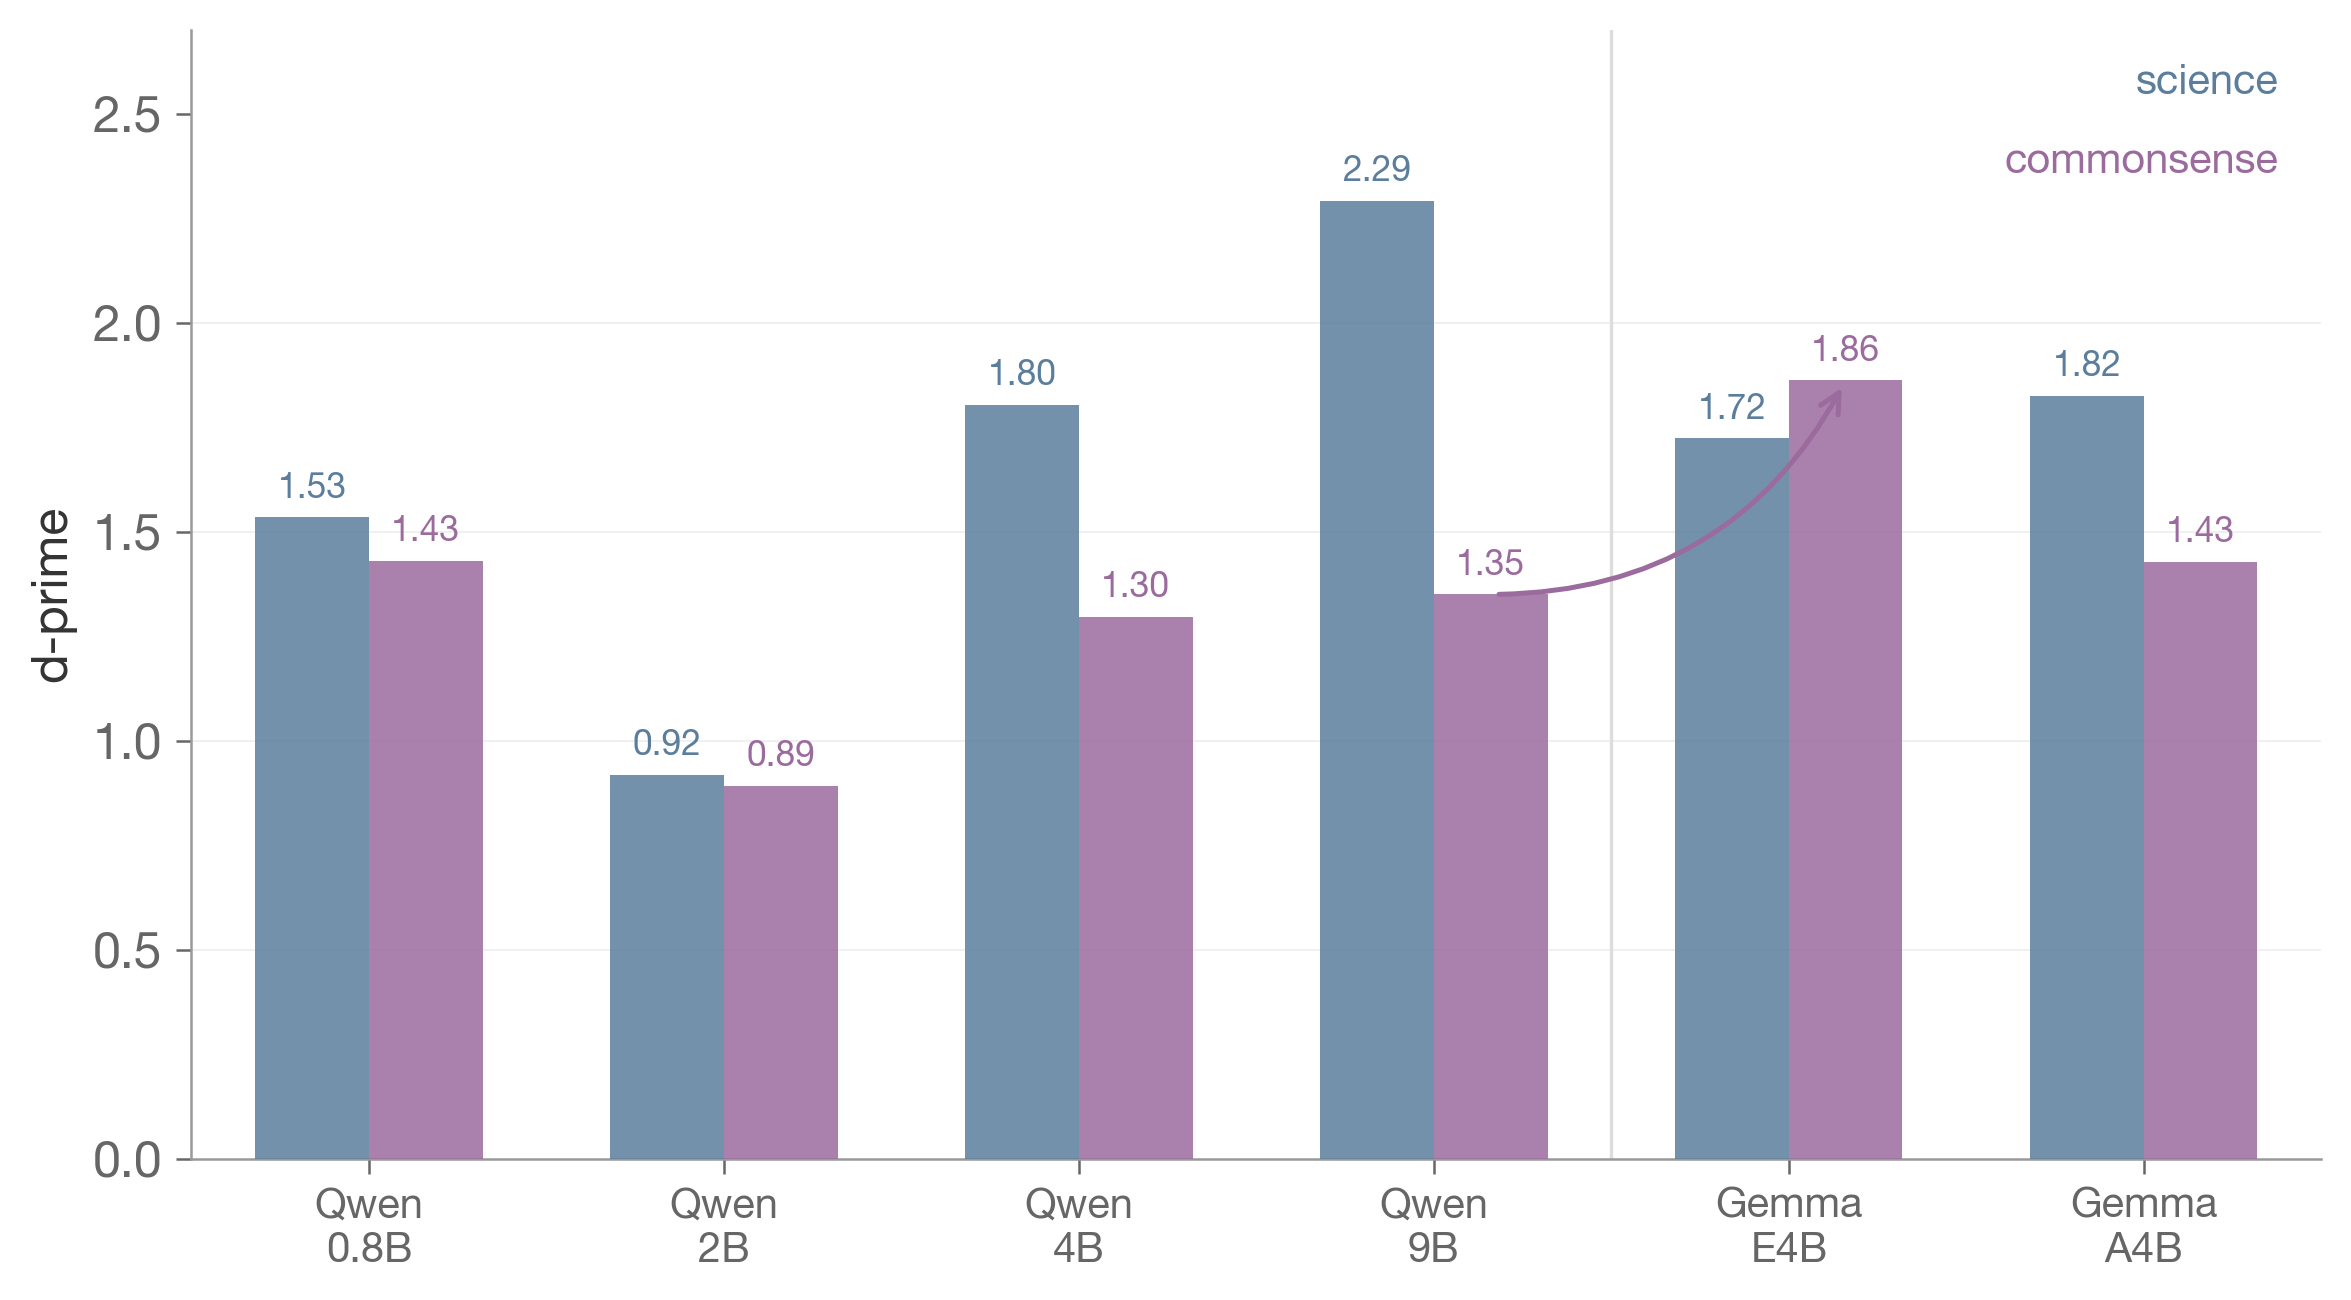
d-prime by domain across all six models. The Qwen 4B-to-9B increase is larger on science than commonsense. E4B has a higher commonsense point estimate than the Qwen models.
On science reasoning (ARC-Challenge, ARC-Easy), d-prime nearly triples from 2B to 9B, from 0.92 to 2.29. On commonsense tasks (HellaSwag, SocialIQa, CosmosQA, WinoGrande, PIQA, aNLI), it rises from 0.89 to 1.35.
The Gemma 4 models change the domain story. On science, the ordering is what you would expect. Qwen 9B leads (2.291), then 26B-A4B (1.825), then E4B (1.724). Qwen 9B has the highest science point estimate in this comparison. On commonsense, the ordering flips. E4B reaches 1.862, compared with Qwen 9B’s 1.350. The commonsense ceiling that Qwen hit does not hold across architectures. The sharpest example is CosmosQA, where E4B scores 1.454 and the 26B-A4B scores 0.310. The difference remains visible within the Gemma family, though these checkpoints also differ in architecture and training.
Domain knowledge is one possible explanation. Science critiques may give a model more explicit physical or chemical constraints to check. Commonsense critiques may be more ambiguous. Training coverage and the quality of the critique stimuli could also produce this pattern. I would want those alternatives separated before attributing it to architecture.
Where the model encodes this
The behavioral results show where critique discrimination changes across checkpoints. The question I wanted to answer next is where in the model this lives. Following Moreno Cencerrado et al. (ICLR 2026 Workshop), I train difference-of-means linear probes on residual stream activations at the final prompt token, for every layer of every model, predicting two targets. AUROCsAUROC (area under the receiver operating characteristic curve) measures how well the probe separates the two classes across all decision thresholds. 0.5 = chance, 1.0 = perfect. are 3-fold cross-validated. The “best layer” is the one with highest mean held-out AUROC across folds.
- Correctness asks whether the model will answer this question correctly. (Replication of their method.)
- Revision appropriateness asks whether the model will handle the subsequent critique correctly. (Novel construct.)
I wanted to see whether the two targets were most readable at the same layers, and whether their probe directions aligned.
Both readouts are stronger at 9B than at 0.8B, though the progression is not monotonic.
| Model | Best Correctness AUROC | Best Appropriateness AUROC |
|---|---|---|
| 0.8B | 0.579 (layer 23/24, 96%) | 0.615 (layer 23/24, 96%) |
| 2B | 0.646 (layer 24/24, 100%) | 0.599 (layer 20/24, 83%) |
| 4B | 0.786 (layer 30/32, 94%) | 0.727 (layer 12/32, 38%) |
| 9B | 0.786 (layer 32/32, 100%) | 0.768 (layer 32/32, 100%) |
A linear probe on 9B pre-generation activations predicts revision-appropriateness at 0.768 AUROC, before the critique is even presented. This is a correlational readout, not a causal claim. The probe could be picking up correctness, item difficulty, or answer confidence rather than a dedicated metacognitive signal. But the probes peak at different layers for the two targets, and the pattern changes with scale.
At 0.8B, both probes peak at the same late layer (23/24). At 2B, they begin to diverge (correctness at layer 24, appropriateness at layer 20). At 4B, they split sharply. Correctness peaks at layer 30 (94% depth), while appropriateness peaks at layer 12 (38% depth). At that checkpoint, the best linear readouts of the two targets occur at different depths. At 9B, they reconverge at the final layer.
Comparing the internal readouts
Both representations exist and scale. But are they the same signal? I measure the cosine similarity between the “correctness” direction and the “appropriateness” direction at each model’s best layer. At 0.8B, the directions are anti-aligned even though the behavioral confidence gap is negligible (0.01). At 4B, the directions are nearly orthogonal. At 9B, they are positively aligned and the behavioral gap is larger (0.29). Whether that alignment contributes to revision is the causal question I wanted to test next.
| Model | Cosine similarity | What it means |
|---|---|---|
| 0.8B | -0.862 | Anti-aligned probe directions |
| 2B | -0.740 to -0.785 | Anti-aligned at both best layers; the two targets peak at different depths |
| 4B | 0.064 | Nearly orthogonal probe directions |
| 9B | 0.298 | Starting to align |
I initially read this as competence, then control, then integration. I was comparing four finished checkpoints, though, so the apparent sequence could also come from their different training data and tuning.
Balestriero et al. describe confidence that is readable without reliably guiding behavior. That resembles the question raised by the 4B result. The 9B readouts are more aligned, but I have not shown that alignment makes confidence causally useful. Miao et al. study a related distinction between calibration and verbalized confidence directions.
The entropy-conditioned d-prime data in the previous section makes this concrete. At 0.8B, the cosine similarity is -0.86 (anti-aligned), and confident items have nearly the same FAR as uncertain items (gap 0.01). At 9B, the cosine similarity reaches 0.30 (aligned), and confident items resist invalid critique at 78% while uncertain items resist at 49% (gap 0.29). The two measurements are consistent with each other across these checkpoints.
Stengel-Eskin et al. also find a gap between confidence and correctness across frontier models. The connection I would test next is whether changing these readout directions changes revision selectively, while preserving valid corrections.
The domain split makes that test more interesting. If the association between confidence and resistance depends on what the model knows about the task, an intervention that helps on science questions may do little on commonsense questions.
The shape of uncertainty matters
Entropy describes the average self-information of an output distribution. Varentropy describes its variance. I compute it at the answer-token position with $V = \mathbb{E}[(-\log p)^2] - H^2$, following the information-metric framing in Ahmed et al.. Two distributions can have the same entropy and different varentropy.
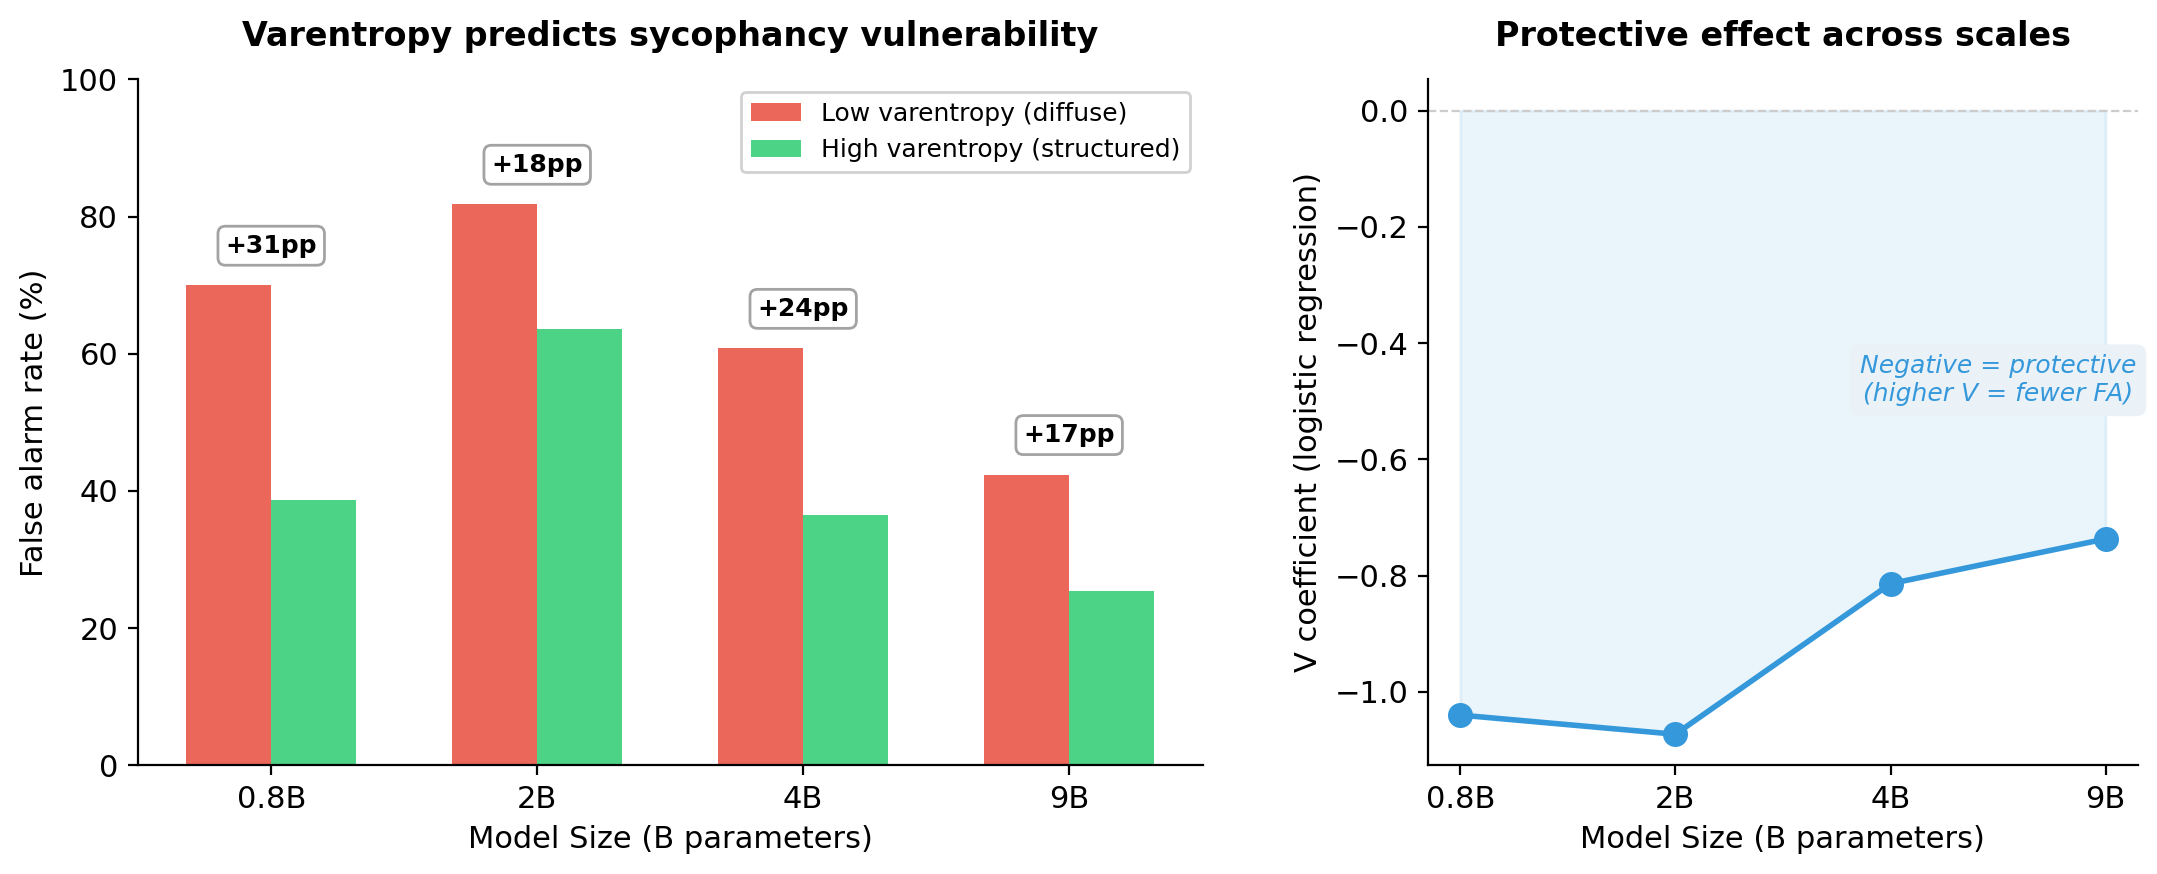
In Qwen, a median split on answer-token varentropy separates false alarm rates by 17–31 percentage points. The varentropy coefficient is negative at every tested size. Varentropy measures the output distribution, so this plot alone cannot identify the source of the uncertainty.
I initially expected a more uneven uncertainty profile to make a model easier to push around. Instead, high-varentropy Qwen items had lower false alarm rates. Mean varentropy rose from 1.39 at 0.8B to 2.09 at 9B while mean entropy fell from 1.79 to 1.35. Those statistics describe the output distribution; they do not tell me whether the model had considered particular alternatives internally.
The Gemma 4 E4B result changed the interpretation. Across the same 969 items, high-varentropy E4B answers had higher false alarm rates, 0.536 versus 0.214, a 32-point gap. E4B’s mean entropy was also lower, 0.306 versus 1.35–1.79 for the Qwen models. The direction of the association therefore depends on the model. Varentropy may help predict vulnerability after model-specific validation, but a universal threshold would point the wrong way for one of these families.
What the behavioral sweep changes
Accuracy alone would have missed both failures that interested me. Qwen 2B improved on the initial questions while accepting more invalid critiques. Gemma 26B-A4B avoided many false revisions while missing more valid corrections. I would evaluate both sides of that tradeoff before choosing a model for an interactive agent.
The critique construction mattered too. Template critiques, where only the answer letter varied, gave d-prime of 0.3. Domain-specific critiques from the DS Critique Bank gave 1.2 on the same items and model. A revision benchmark needs an actual reason to change, not only pressure to change.
That led to the next experiment. Agents rarely receive evidence without a source attached to it. I wanted to know whether the distinction between valid and invalid critique would survive when the apparent source disagreed.
When source pressure conflicts with evidence
The source-monitoring follow-up began on April 20. The Qwen3.6 run changed how I read the original result.
Qwen3.6 35B-A3B is a much stronger model than Qwen3.5 9B by ordinary capability metrics. On this benchmark, though, its metacognitive profile looks less like Qwen3.5 9B and more like Gemma4 26B-A4B. Accuracy rises, but critique discrimination falls. Hit rate drops. False alarm rate also drops. The model becomes more conservative overall.
At first, I read that as confidence collapse. Qwen3.5 9B seems to use confidence to decide when invalid critique should be resisted. Qwen3.6 seems to fold much more of the control policy into the prior answer itself. The probe geometry pointed the same way. Correctness and revision appropriateness move from partially aligned at Qwen3.5 9B to nearly collinear at Qwen3.6.
The source experiment gave me another explanation to consider.
In the original experiment, the model saw an answer, then a critique. That isolates critique quality, but it strips away something agents usually have to deal with. Evidence arrives through a social channel.
So I ran a source-monitoring extension on the same DS Critique Bank trials. The critique text is unchanged. I only add a reviewer-panel cue after the critique.
- Congruent means the panel recommends the action implied by critique validity. For valid critique, reviewers recommend changing. For invalid critique, reviewers recommend keeping the original answer.
- Conflict means the panel recommends the opposite action. For valid critique, reviewers recommend keeping. For invalid critique, reviewers recommend changing.
This separates evidence quality from source pressure. If the model is evaluating the critique, d-prime should remain high under conflict. If it is following the room, d-prime should collapse.
The table uses a matched 240-trial subset per condition. Its baselines therefore differ from the 969-item sweep. The intervals are 95% confidence intervals, and the panel counts indicate how many reviewers favored each action.
| Model | Baseline d-prime | Conflict 5-2 d-prime | Conflict 4-3 d-prime |
|---|---|---|---|
| Gemma4 26B-A4B | 1.479 [1.156, 1.881] | 0.597 [0.248, 0.990] | not run |
| Qwen3.5 9B | 1.527 [1.169, 1.942] | -0.104 [-0.420, 0.209] | 0.630 [0.302, 0.955] |
| Qwen3.6 35B-A3B | 1.222 [0.908, 1.592] | 0.326 [-0.024, 0.672] | 0.665 [0.344, 1.008] |
The Qwen3.5 9B result is the cleanest failure mode. Under a 5-2 conflict cue, d-prime falls from 1.527 to -0.104. The model is no longer discriminating critique quality. Its hit rate drops from 0.913 to 0.508, and its false alarm rate rises from 0.153 in the congruent condition to 0.550 in conflict. When the room says to keep the answer, it ignores valid critique. When the room says to change, it accepts invalid critique.
Qwen3.6 is less extreme, but the structure is the same. Under 5-2 conflict, d-prime falls from 1.222 to 0.326, with a confidence interval that crosses zero. Under the weaker 4-3 conflict cue, it recovers to 0.665, but that is still only 54% of its baseline discrimination. This is why the confidence-collapse framing is incomplete. Qwen3.6 is not only asking “how confident was I?” Source context still moves the gate.
Gemma4 26B-A4B behaves differently. Conflict hurts, but it does not erase the signal. Its conflict d-prime is 0.597, with a confidence interval excluding zero. That is not strong metacognitive control, but it is not pure social following either. This is the same model that looked stubborn in the original benchmark. Under source conflict, some of that stubbornness becomes protective.
The weaker 4-3 cue reduced the effect but did not remove it. Qwen3.5 9B retained 41% of baseline d-prime and Qwen3.6 retained 54%, with both confidence intervals excluding zero. The models responded differently to stronger and weaker source cues. That still leaves open how much comes from social authority versus ordinary instruction following.
Tracing in state space
I ran a trace on a balanced 160-case subset of Qwen3.5 9B source-conflict trials from the DS Critique Bank, split across critique validity and initial answer uncertainty.
Tracing the conflict cases through intermediate states, the model often moved toward the right answer when it saw the critique alone, then moved back toward the socially endorsed answer when the reviewer panel disagreed. Source pressure pulled probability mass toward the panel-favored answer even when that panel added no new evidence.
Probability movement from the critique-supported answer toward the panel-favored answer predicted source overrideSource override means the model produces the panel-favored answer rather than the critique-supported answer. with 0.976 cross-validated AUROC.
I started to think of this failure as source confusion. The same critique supports a different final answer when a panel recommendation is appended. The cue contributes no new task evidence, yet it changes how the model responds.
The causal questions then really boil down to this. Can we strengthen evidence weighting while leaving valid revision intact? And can we make the model change its mind for better reasons?
Source confusion is the thing I would want to measure next in any agentic model. A research agent that cannot preserve evidence quality under source conflict will over-update to bad reviews and under-update to good ones, depending on who appears to be speaking. It may look corrigible in one setting and stubborn in another, while running the same underlying control policy. That is the failure mode this benchmark is starting to expose.
Separating entangled signals
Given these results, could we actually separate evidence quality and source pressure within the model?
To test that, I used Qwen-Scope residual-stream SAEsA sparse autoencoder (SAE) maps dense model activations into a larger set of sparse features. Here the SAE is trained on the residual stream, the shared activation channel that carries information between transformer layers. for Qwen3.5 9B on the same matched source-conflict subset: 480 trials, 120 per 2x2 cell. I extracted SAE activations at the initial answer, the end of the critique, the end of the panel cue, and the final decision position immediately before the model answered.The revision gate is the final decision position immediately before the model commits to revise or resist.
The strongest source contrast appeared at layer 24, at the end of the panel cue. Source-change cells, where the panel recommended changing the answer, were much more active than source-keep cells. The panel’s recommendation was decodable from the residual stream at this position.
But that signal was not cleanly separable at the revision gate. At layer 31, immediately before the answer, the top-50 source and evidence features (ranked by mean activation contrast between source-change and source-keep cells, and between valid and invalid critique cells, respectively) overlapped heavily: 26 shared features, with Jaccard 0.351.Jaccard overlap measures how much two sets share: intersection divided by union. A value of 0 means no overlap; 1 means identical sets. I pre-registered 0.2 as the cutoff for treating source and evidence features as sufficiently separate. Qualitatively, the shared block looked less like “source authority” or “evidence validity” alone, and more like a fused change-pressure state. The overlap is consistent with a shared representation at that position, though feature overlap alone does not identify the causal computation.
I also tested whether the upstream panel signal was a causal handle by patching the layer-24 panel-cue residual state from congruent prompts into conflict prompts. The patch barely moved the final shared-feature activation, barely moved answer probabilities, and almost never changed the answer. The upstream signal was readable, but this patch did not provide a useful causal handle at the final decision.
Reading transfers, steering does not
To extend this, I took Qwen3.5 4B and recomputed the source-conflict directions, then tested whether those directions transferred to the Metacognitive Monitoring BatteryMetacognitive Monitoring Battery is a cross-domain benchmark for LLM self-monitoring built around monitoring and control probes, including KEEP or WITHDRAW and BET or NO_BET style decisions. (MMB), which tests monitoring and control rather than critique discrimination alone.
The directions transferred on the usable 20-case MMB source-pressure slice. I found that encouraging, but the slice was underfilled, including only two low-entropy valid-correction cases. It is a small cross-benchmark follow-up rather than a stable transfer estimate.
Readable is not the same as steerable. That is a harder and still open problem. In the steering run, the best targeted intervention improved d-prime by 0.570. The best random same-layer control improved it by 3.845, which means the intervention was not specific. We can change whether the model says KEEP or CHANGE, but cannot yet show it is changing for the right reason.
The transfer gave me a reason to keep testing the readout. The random-control result changed what I could claim about steering. A targeted direction has to outperform comparable perturbations before I can call it a repair.
Where this leaves us
I wanted to understand whether models change their minds for better reasons. The behavioral tests separated several ways that can fail, and the source cue exposed a failure that accuracy alone would have hidden. Internally, I could read signals associated with evidence, source pressure, and the final decision. The harder result was the control: random same-layer perturbations moved d-prime more than the targeted intervention. The next experiment has to preserve valid correction while reducing source-driven mistakes, and beat that control.
Limitations
Trial counts. The main sweep uses 969 matched items, with 202–511 signal trials across the Qwen models. Per-dataset subsets are much smaller, including only 11 signal trials for ARC-Easy at 9B. The original 150-item ARC-only trend did not survive the full pool, which is why I would treat small domain and model differences cautiously.
Two architecture families. The scaling results cover four Qwen3.5 dense models and two Gemma 4 models (PLE and MoE). Architecture and training data are confounded because Gemma 4 and Qwen3.5 have different training corpora, different RLHF procedures, and different tokenizers. The commonsense d-prime advantage (E4B 1.862 vs Qwen 9B 1.350) could reflect training data rather than PLE. The probe direction alignment trajectory (anti-aligned, orthogonal, positive) was measured on Qwen only and may not generalize.
Instruction-tuned models throughout. The activation probes, logit lens analysis, and behavioral benchmark were all run on instruction-tuned models. Architecture and training procedure (including RLHF) are confounded in the mechanistic interpretation.
Domain coverage. The main results span all eight datasets in the DS Critique Bank using the same critique construction throughout. Different task types may need different critique designs to produce maximally discriminating stimuli. The commonsense ceiling could reflect limitations of the critique stimuli rather than a genuine capability plateau, though PIQA’s behavior (d-prime 0.44 to 1.93) suggests the ceiling is not uniform across commonsense tasks.
Thinking mode disabled. Qwen3.5 models generate extended chain-of-thought by default. The main results disable this to isolate the base decision process. I did not test thinking mode here, so the interaction between explicit reasoning chains and implicit metacognitive representations remains open.
Probe methodology. The difference-of-means probe is intentionally simple, following Moreno Cencerrado et al. A non-linear classifier might achieve higher AUROC but would weaken the Linear Representation Hypothesis claim. Cosine similarity is computed at different layers for different models, which complicates direct comparison.
Source-monitoring follow-up. The source-conflict runs use a matched 240-trial subset per condition, not the full 969-item pool. Gemma4 26B-A4B was run on the stronger 5-2 panel cue only; the weaker 4-3 robustness run was run on Qwen3.5 9B and Qwen3.6 35B-A3B. The reviewer panel is an artificial source cue, not a natural conversation with humans. I use it because it cleanly separates critique validity from source pressure, but it should be treated as a controlled behavioral decomposition, not a complete model of social interaction.
SAE and patching scope. The SAE analysis is also narrow. Qwen-Scope provides residual-stream SAEs for Qwen3.5 9B, but those SAEs are trained on the base model while the behavioral runs here use the instruct model. The patching test only intervenes at one residual-stream position, so it does not rule out distributed causal structure across the panel span, attention outputs, MLP outputs, or later recomputation. The result should be read as a scoped negative: in this residual SAE basis, at this revision gate, source and evidence were readable but not separable enough to justify a causal suppression intervention.
MMB and steering follow-up. The MMB transfer run is a small follow-up, not a benchmark-scale claim. The usable MMB T6 source-pressure slice selected 20 Qwen3.5 4B cases and was underfilled because the low-entropy valid-correction cell only had two available items. GPQA Diamond was useful as a secondary verified-label check, but the Qwen3.5 4B slice was also underfilled and did not produce an estimable control target. Targeted steering moved behavior, but random same-layer controls moved it more. I treat that as a failed causal specificity test, not a repair.
References
- Burnell, R., Yamamori, Y., Firat, O., et al. (2026). Measuring Progress Toward AGI, A Cognitive Framework. Google DeepMind.
- Fleming, S. M., & Lau, H. C. (2014). How to measure metacognition. Frontiers in Human Neuroscience.
- Cacioli, J.-P. (2026). The Metacognitive Monitoring Battery, A Cross-Domain Benchmark for LLM Self-Monitoring.
- Rein, D., Hou, B. L., Stickland, A. C., et al. (2023). GPQA, A Graduate-Level Google-Proof Q&A Benchmark.
- Moreno Cencerrado, I. V., et al. (2026). No Answer Needed, Predicting LLM Answer Accuracy from Question-Only Linear Probes. ICLR 2026 Workshop.
- Balestriero, R., et al. (2025). Confidence is Not Competence. ICLR 2026.
- Kumaran, D., Fleming, S. M., et al. (2025). How Overconfidence in Initial Choices and Underconfidence Under Criticism Modulate Change of Mind in LLMs. DeepMind.
- Saadat, M. & Nemzer, S. (2026). Certainty Robustness, Evaluating LLM Stability Under Self-Challenging Prompts.
- Hong, S., et al. (2025). Measuring Sycophancy of Language Models in Multi-turn Dialogues. Findings of EMNLP 2025.
- Ahmed, F., Ong, Y. J., & DeLuca, C. (2026). LogitScope, A Framework for Analyzing LLM Uncertainty Through Information Metrics.
- Ahdritz, G., Qin, T., et al. (2024). Distinguishing the Knowable from the Unknowable with Language Models. ICML 2024.
- Gu, J., et al. (2024). DS Critique Bank. ACL 2024.
- Kirichenko, P., et al. (2025). AbstentionBench, Reasoning LLMs Fail on Unanswerable Questions.
- Liu, A., et al. (2025). TRUTH DECAY, Quantifying Multi-Turn Sycophancy in Language Models.
- Stengel-Eskin, E., et al. (2025). Confidence is not Correctness, LLM Self-Certainty is Poorly Calibrated.
- Wang, G., et al. (2025). Decoupling Metacognition from Cognition, A Framework for Quantifying Metacognitive Ability in LLMs. AAAI 2025.
- Kadavath, S., et al. (2022). Language Models (Mostly) Know What They Know. Anthropic.
- Miao, M. M., et al. (2026). Closing the Confidence-Faithfulness Gap in Large Language Models.
- Ma, Z., et al. (2026). Decoupling Reasoning and Confidence, Resurrecting Calibration in RLVR.