Verification
Where should test-time compute go? Surprisal-guided selection in verifiable environments
- Where should test-time compute go?
- GPU kernel optimization as testbed
- What I ran
- Selecting by surprisal
- Why not just train more?
- When this works and when it doesn’t
- Can you skip evaluation with surprisal?
- What to do with this
- What this doesn’t cover
- Try it yourself
- Resources
- Citation
Where should test-time compute go?
Test-time adaptation shows strong results on reasoning and discovery tasks. TTT-Discover uses ~50 gradient steps to push past what base models can achieve. The practical question: does this generalize when the reward signal is dense and continuous? I tested on GPU kernel optimization to find out.
Given a capable code-generation model, three options: more training (gradient adaptation), more samples (search), or smarter selection.
I tested all three on KernelBench using GPT-OSS-120B with LoRA adaptation. The full Best-of-N evaluation covered 20 L1 tasks. The primary selector comparison used five tasks across two seeds, and the adaptation comparison used small task subsets.
GPU kernel optimization as testbed
KernelBench evaluates 250 GPU kernel optimization tasks. Given a PyTorch operation, the model generates an efficient CUDA kernel. The compiler and hardware provide ground-truth feedback: functional correctness and continuous speedup (0x to 10x+). No human judgment. I evaluate on all 20 KernelBench L1 eval tasks using GPT-OSS-120B with LoRA adaptation.
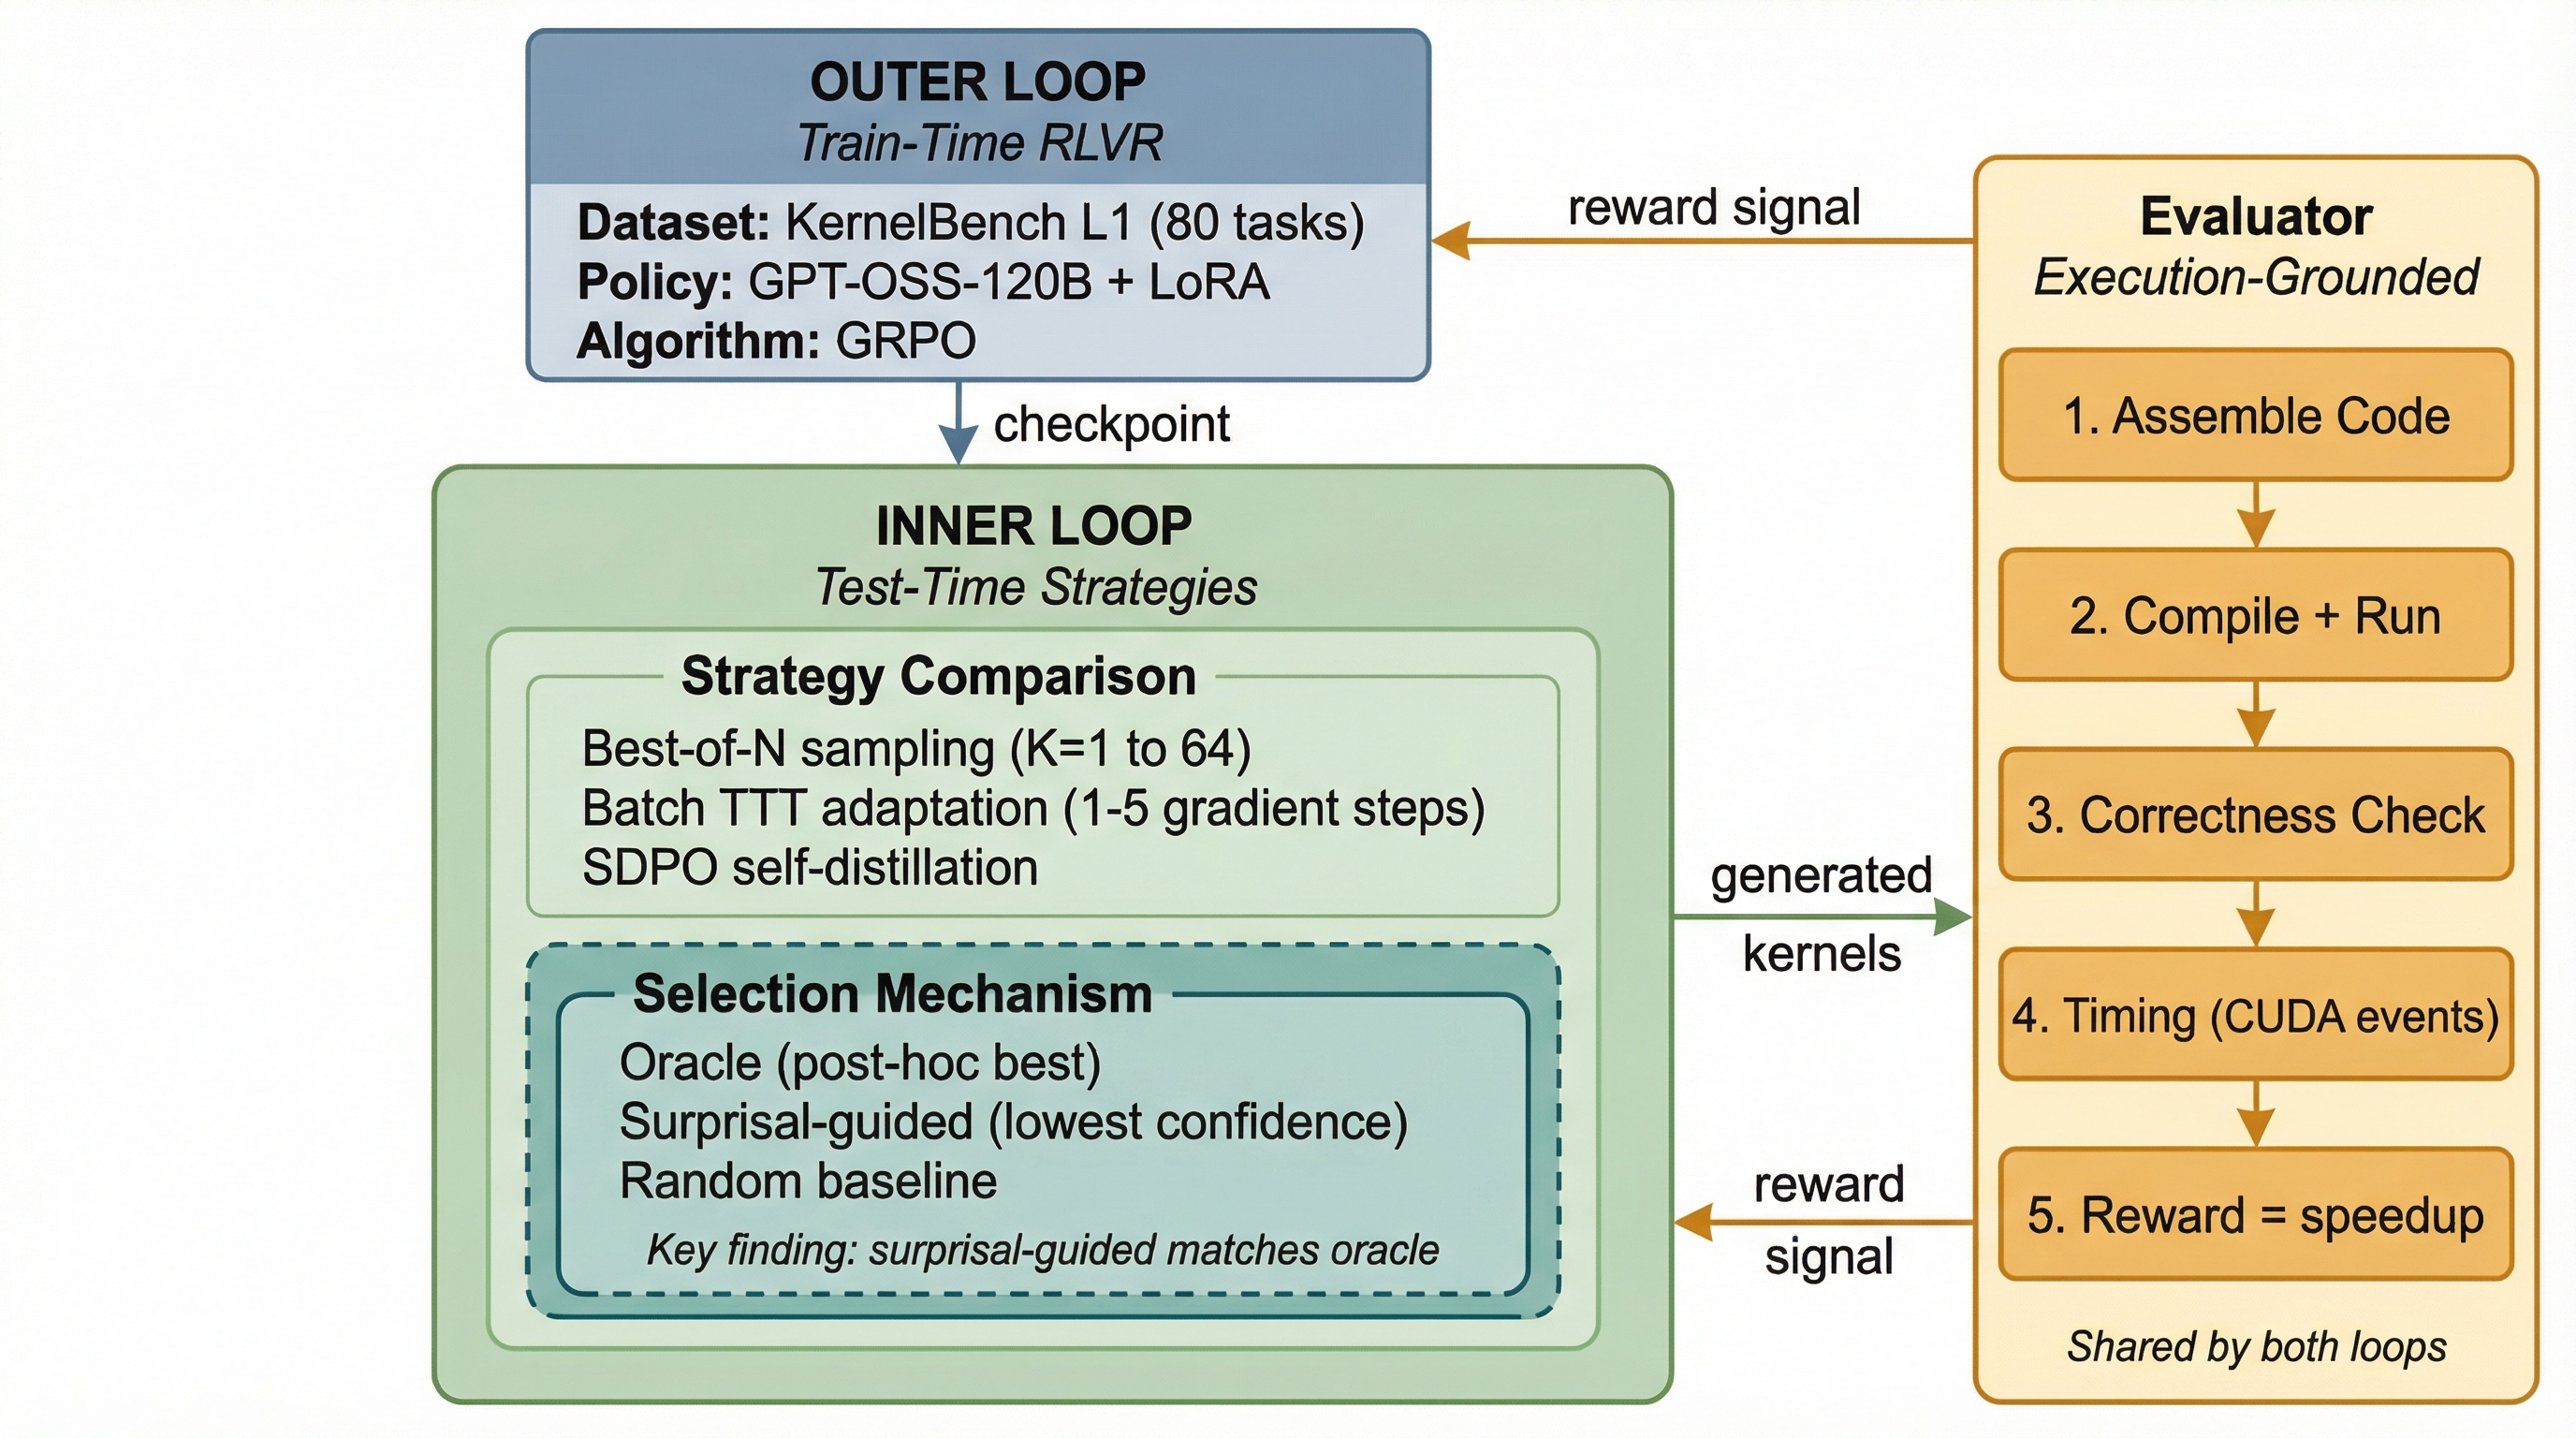
Dual-loop architecture. The outer loop trains a base policy via reinforcement learning with verifiable rewards (RLVR) on 80 tasks. The inner loop compares test-time strategies (TTT, Best-of-N, and selection mechanisms) against the same execution-grounded evaluator. Rollout matching does not account for the extra cost of gradient updates.
What I ran
I train a base policy using Group Relative Policy Optimization (GRPO) on 80 KernelBench L1 tasks with LoRA.LoRA (Low-Rank Adaptation): a parameter-efficient fine-tuning method that trains small rank-decomposed matrices instead of full model weights. Cuts trainable parameters by ~100x. The checkpoint achieves 98.4% correctness and 0.87x mean speedup, a capable starting point. The subset comparisons start from the same checkpoint at temperature 0.25. The comparisons match rollout counts where stated, with training compute paid separately.
Best-of-N (K=64) samples 64 candidates per task and selects the fastest correct one. A five-task subset therefore uses 320 candidates; the full 20-task sweep uses 1,280.
Batch TTT takes 1–5 gradient steps with 32 rollouts per task per step, then selects a checkpoint with Best-of-Adaptation (BoA). The compute includes training as well as rollout generation and evaluation.
Selection strategies: Given K=64 samples per task, compare oracle, random, confidence-guided (highest log-probability), and surprisal-guided (lowest log-probability) selection.
Selecting by surprisal
I measure fast_1: the fraction of selected samples that are both correct and achieve speedup > 1x over the reference implementation.
| Strategy | fast_1 | std | Mean Speedup |
|---|---|---|---|
| Oracle (best correct) | 100% | 0% | 226.9x |
| Surprisal-guided-top3 | 100% | 0% | 139.0x |
| Surprisal-guided | 80% | 0% | 41.2x |
| Random correct | 59.2% | 2.7% | 30.0x |
| Confidence-guided | 50% | 14.1% | 11.6x |
Selection comparison on five tasks across two seeds (10 task-seed pairs). All selectors act on correctness-filtered candidates. fast_1 is the fraction of selected outputs faster than the reference. Matching the oracle on fast_1 does not match its mean speedup, 139.0x versus 226.9x.
Surprisal-guided beats confidence-guided by 30 percentage points (80% vs 50%, Cohen’s h = 0.64).Cohen’s h: an effect size for comparing two proportions. 0.2 = small, 0.5 = medium, 0.8 = large. Evaluating the 3 highest-surprisal correct samples and picking the fastest matches oracle at 100%. Surprisal is the negative sum of token log-probabilities. When those log-probabilities are recorded during generation, ranking adds no model calls. Correctness checks and timing still cost compute.
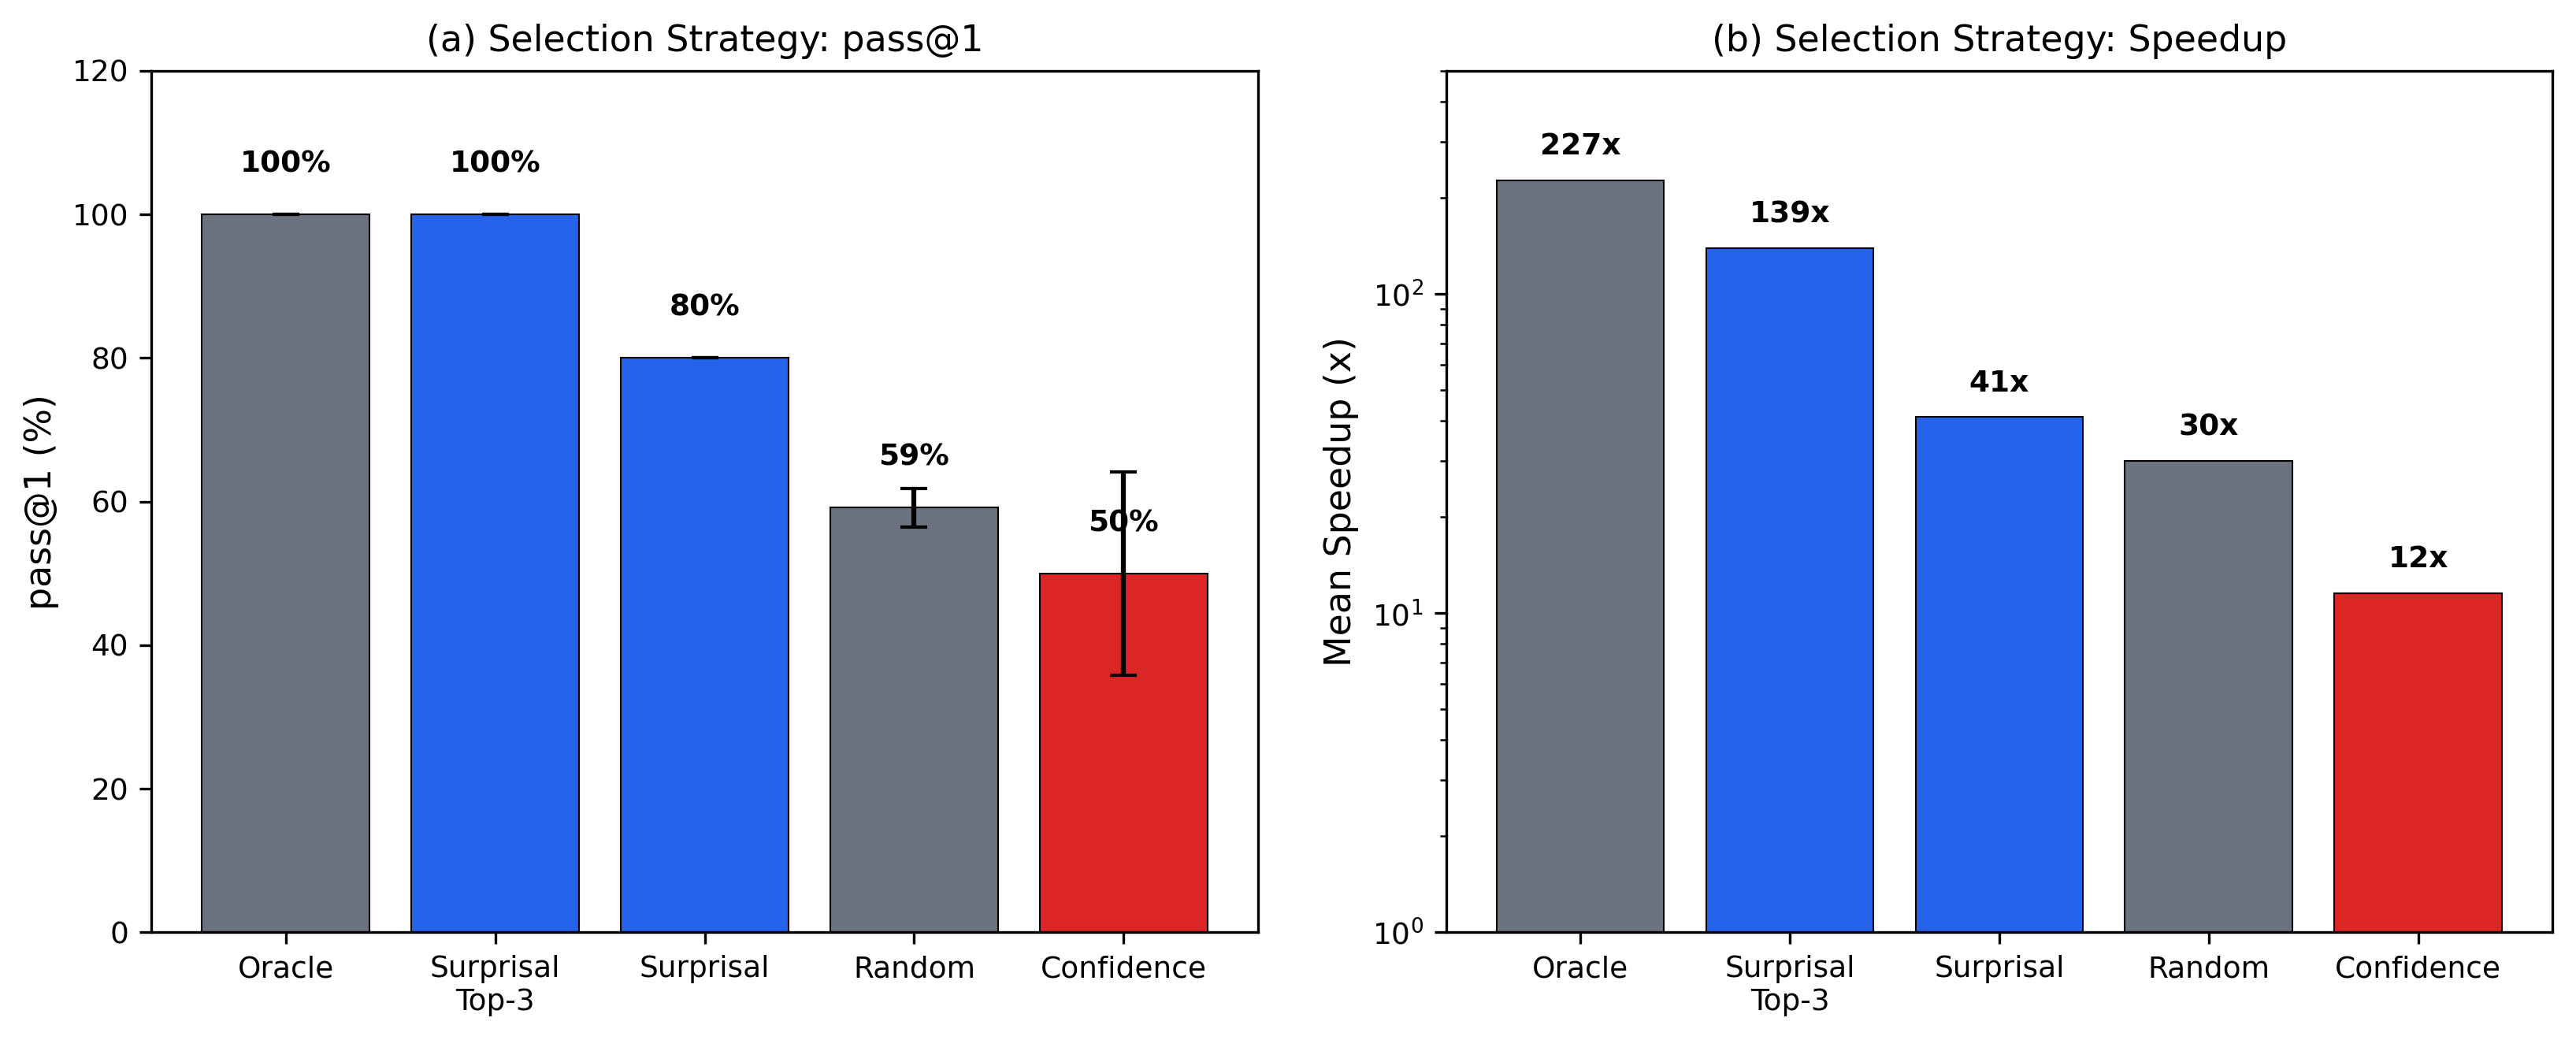
Surprisal-guided (blue) vs confidence-guided (red). The gap is consistent across seeds. Confidence-guided std = 14.1%; surprisal-guided std = 0%.
A distinction worth flagging: I select the most surprising correct sample, not the most surprising overall. Before filtering, high surprisal also selects malformed code. The execution-grounded setting supplies that filter through compilation and execution, which remain part of the compute budget.
One possible explanation is that the model assigns high probability to common code patterns rather than to the fastest implementation on this hardware. The selector result is consistent with that explanation; this experiment does not measure how often the kernel strategies appeared in pretraining.
I call the useful low-probability candidates the Expert Tail. They are correct kernels that the model can generate but ranks below more likely alternatives. Unlike S*, the ranking here uses already recorded log-probabilities rather than additional model calls. Its usefulness still depends on task-specific variation and the correctness filter.
I also checked sequence length, since longer outputs accumulate more negative log-probability. Across 550 correct samples, the length-controlled correlation between log-probability and speedup was near zero (rho = 0.003, p = 0.95). That still leaves a per-task question. Would the selector work as well with length-matched candidates or normalized scores? The global correlation cannot answer it.
The quartile breakdown helps bound the claim. Q2 (second-highest surprisal) shows the highest fast_1 at 81.0%; Q4 (lowest surprisal) shows the lowest at 43.9%. The strongest quartile is in the high-surprisal half, rather than at its extreme.
Why not just train more?
I started this project expecting TTT to help. The short adaptation runs underperformed the sampling baseline.
Best-of-N at K=64 achieves 90% task success (18/20 L1 eval tasks). Task 82 reaches 100% correctness but only 1.00x speedup against a cuDNN reference; Task 95 reaches 0% correctness. These were the two remaining failures at K=64. On the five-task comparison below, TTT’s best checkpoint reaches 30.6% (three-seed mean), below the 53.3% single-sample baseline.
| Method | fast_1 | Equivalent K |
|---|---|---|
| Best-of-N K=64 | 100% | 64 |
| Best-of-N K=1 | 53.3% | 1 |
| TTT BoA (3-seed mean) | 30.6% | < 1 |
Subset 1 (5 tasks). Best-of-N achieves 90% (18/20) on the full L1 eval set.
Performance often peaked after one or two adaptation steps and then regressed. I use over-sharpening as a candidate explanation for this pattern, not an established probability-level mechanism.
Correction, September 8. I removed the earlier NLL-speedup interpretation and figure. The reported negative correlation has the opposite direction under the stated NLL definition, so it cannot support the claim that adaptation increased confidence in worse solutions.
Cross-subset transfer also deteriorated. Checkpoints adapted on Subset 1 and evaluated on Subset 2 achieved 7.5% fast_1, down from the unadapted baseline of 17.5%. Both transfer directions degraded. The short updates did not improve transfer to the other subset.
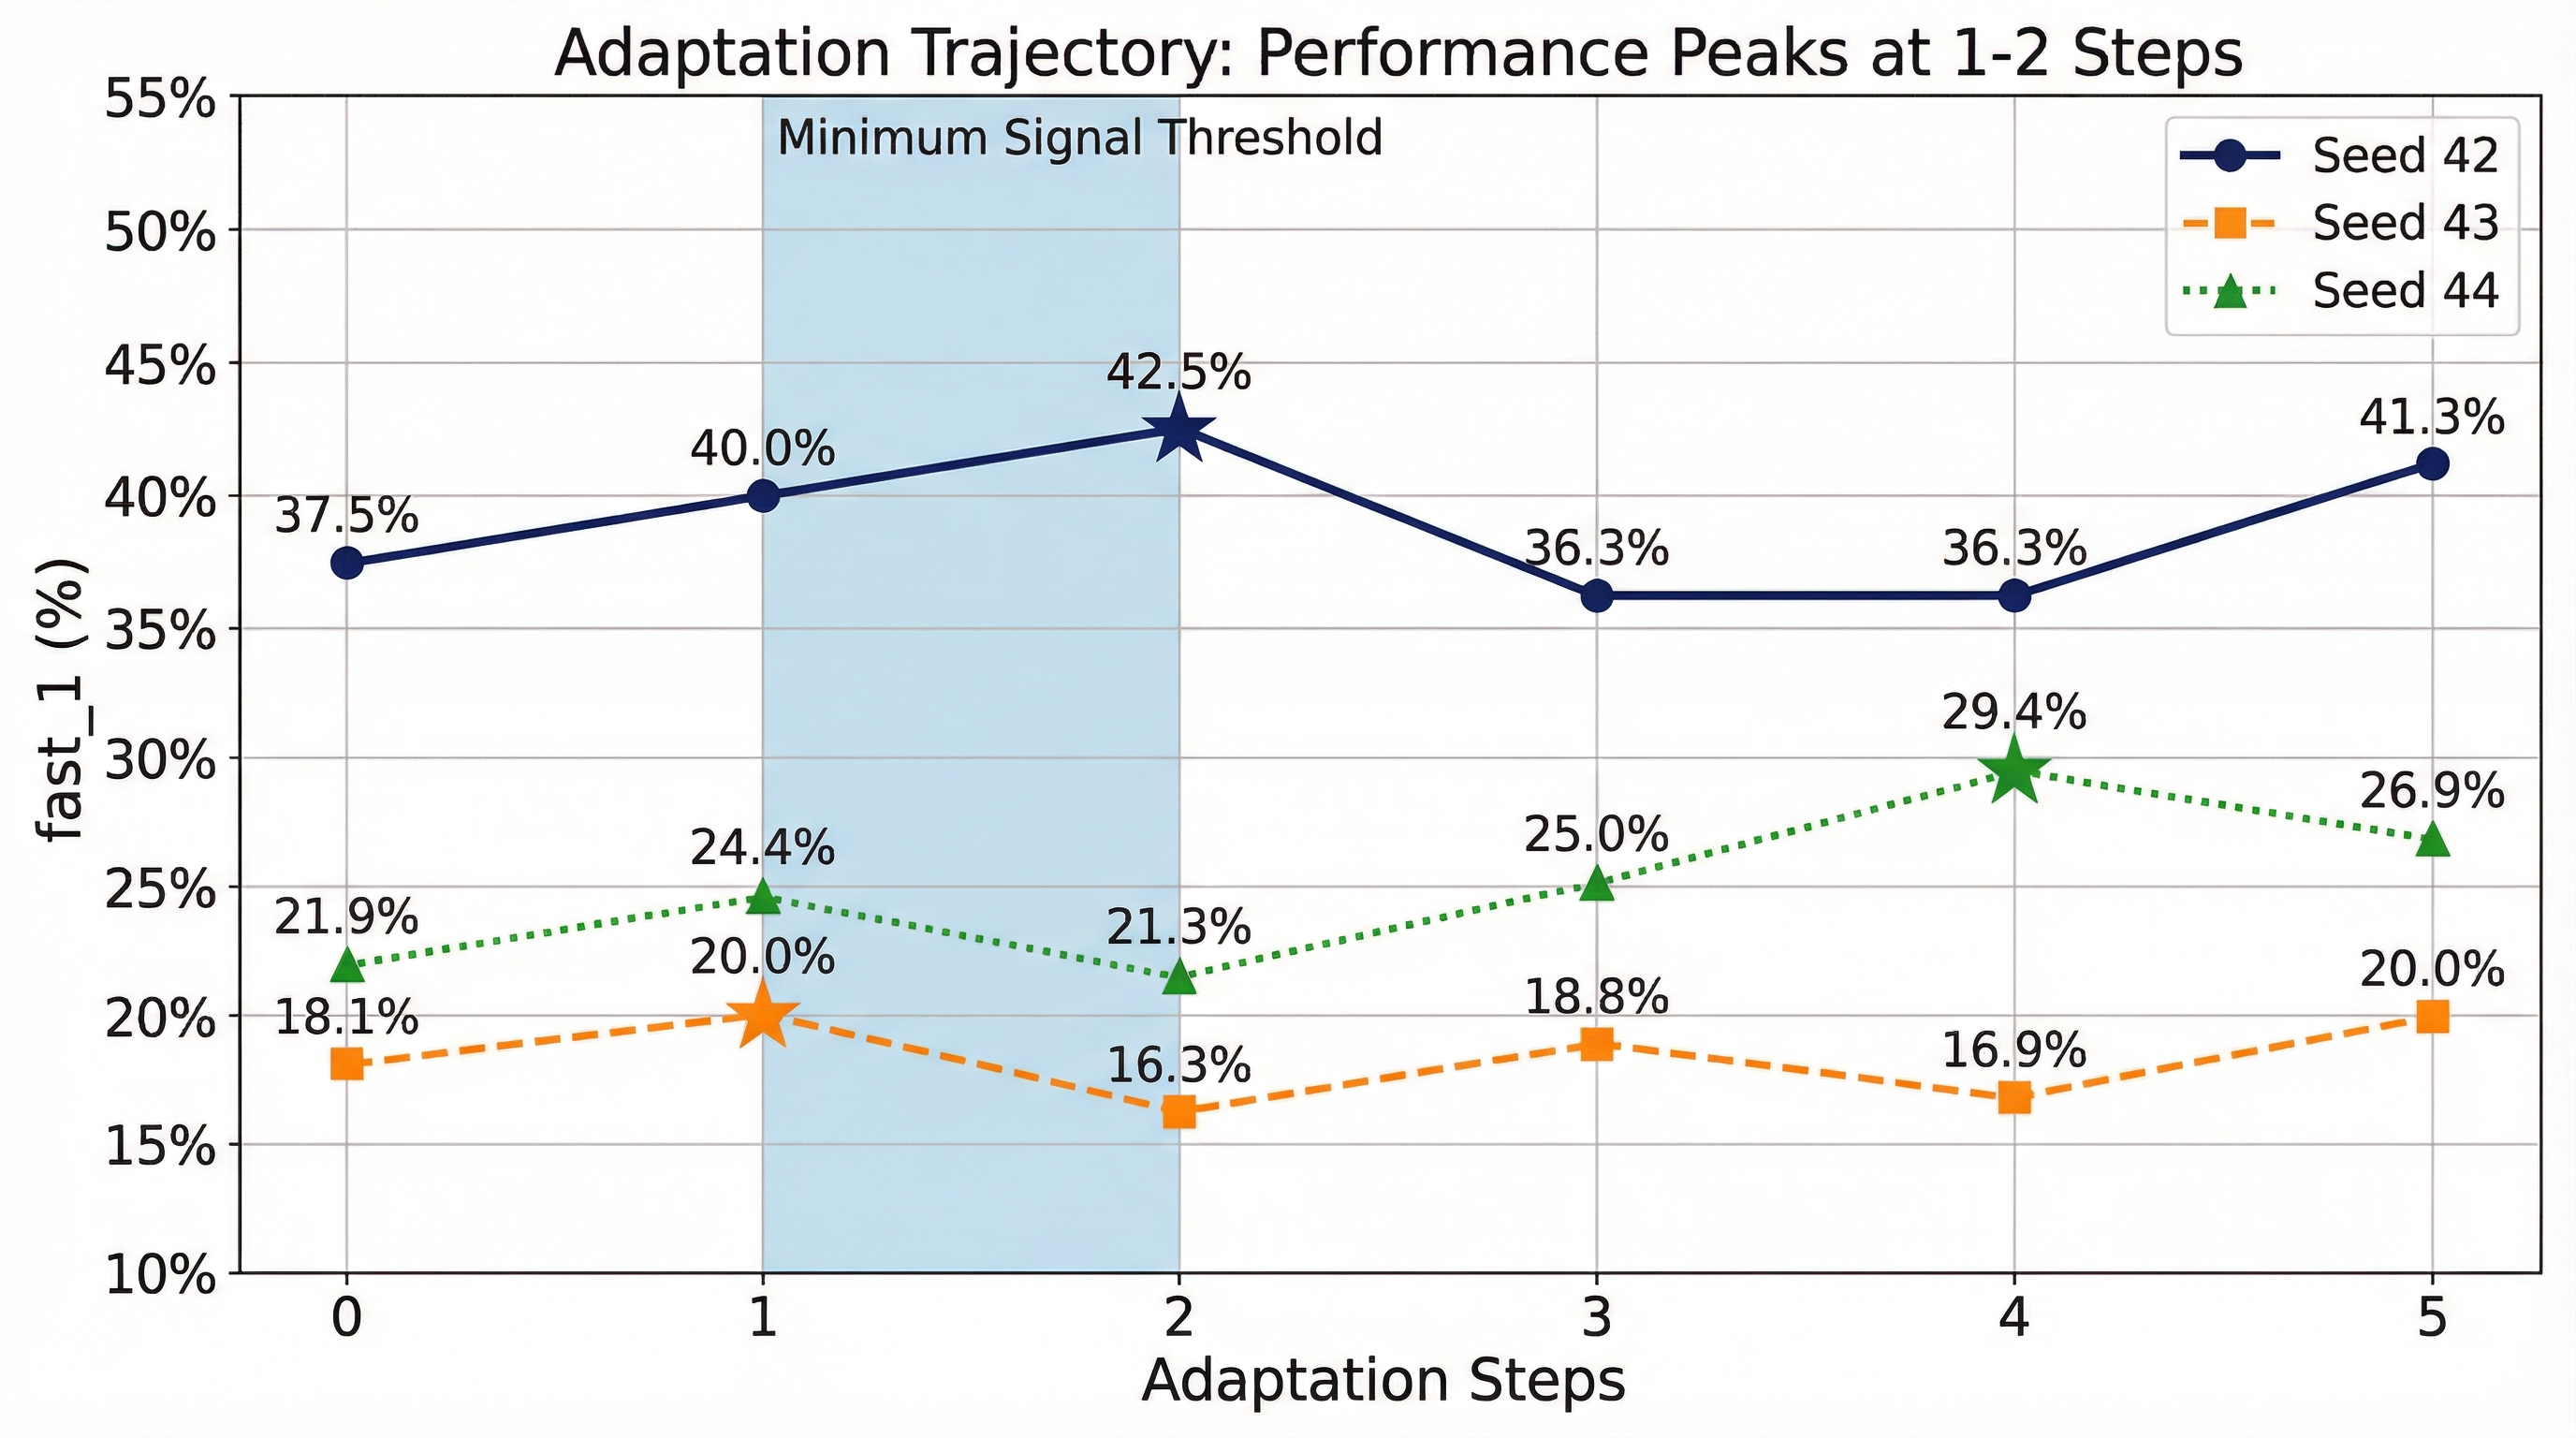
Performance peaks at 1-2 steps then regresses. Stars mark BoA-selected checkpoints. The early-peak pattern appears across learning rates spanning three orders of magnitude.
When this works and when it doesn’t
Surprisal-guided selection requires two things: correct samples to select from, and enough logprob variance within each task.
Of 20 L1 eval tasks, 9 have high logprob variance (std > 1.0), tasks with diverse solution strategies that create a gradient for selection to exploit. The remaining 11 produce near-identical logprobs across samples, primarily convolution and normalization operations where the model converges to a narrow template. On those tasks, the score offers little separation between candidates.
The adaptation regime also matters. Across the two five-task subsets, TTT underperformed Best-of-N by 9–21 percentage points. Coverage varied by task, so a single aggregate result should not be read as a universal threshold for choosing training over search.
Self-Distilled Policy Optimization (SDPO) in prompt-only mode achieves comparable results to TTT’s best checkpoint (30.4% vs 30.6%) under matched rollout budgets, consistent across three seeds. Adding teacher-interpreted execution feedback lowered SDPO to 26.3%, a 4.1 percentage point deficit.
Reward density is one possible explanation for the short adaptation horizon. It is not isolated here from the task distribution, starting policy, objective, or optimizer. TTT-Discover reports useful longer adaptation in a different setting. Comparing those outcomes does not establish an inverse law between reward density and the number of useful gradient steps.
Can you skip evaluation with surprisal?
I tested whether ranking by surprisal before correctness evaluation could cut evaluation cost. Across 30 task-seed pairs, it does not work at small budgets. At m=5 (evaluating 8% of candidates), surprisal achieves 43% task success versus 59% for random. The extreme high-surprisal tail mixes expert solutions with malformed code the model correctly considers unlikely. Without the correctness filter, you cannot tell them apart.
The crossover is at m=16 (25% of K), where surprisal pulls ahead by 7.5 percentage points. Confidence is worst at every budget level. The useful ranking appears after correctness filtering. Ranking the survivors adds no model calls when their log-probabilities have already been recorded.
What to do with this
The tested setting is GPU kernel optimization with execution-based correctness checks and timing. Assembly optimization and formal theorem proving also offer verifiers, but transferring this selector to them remains an experiment.
For these tasks, sample K=16-64 candidates, filter for correctness, then rank by surprisal using the recorded log-probabilities. The ranking requires no additional model calls; generation and correctness evaluation remain part of the inference budget.
I showed in a previous post that supervised fine-tuning plus test-time selection matched GRPO at Pass@4 on multi-turn tool-use. Both experiments make sampling and selection useful baselines before adding training. Neither establishes that selection generally beats RL.
My OpenSec work raised a related question about acting on a strong prior when the evidence points elsewhere. The security agents took incorrect containment actions in 45–97.5% of simulated episodes. I see an analogy with premature commitment, but the two experiments would need separate causal tests before I could give them the same explanation.
For evaluation, I would keep both high-coverage and low-coverage tasks in the set. The failures here differ between a task where every kernel is correct but none is faster and a task where the model never produces a correct candidate. A selector has different room to help in each case.
What this doesn’t cover
Selection strategy analysis covers 10 task-seed pairs (5 tasks x 2 seeds). The primary comparison (80% vs 50%) shows a medium-to-large effect (Cohen’s h = 0.64). The sign test at n = 10 gives p = 0.125, so I treat the selector comparison as a small exploratory result. Best-of-N covers all 20 L1 tasks. I tested a single 120B model. Transfer to other scales is open. Evaluation uses fast-proxy protocol (5 timing trials per kernel).
The inverse confidence-quality relationship may be domain-specific. In kernel optimization, rare creative solutions yield high speedups. In domains where the distribution mode represents optimal behavior, surprisal-guided selection could underperform. The surprisal signal also vanishes on 11/20 tasks where the model produces near-identical solutions.
Try it yourself
# Clone the repo
git clone --recursive https://github.com/jbarnes850/test-time-training.git
cd test-time-training

# Install dependencies
uv sync --extra dev

# Run Best-of-N with selection analysis
uv run python -m scripts.best_of_n \
  --split splits/l1_seed42.json \
  --subset eval \
  --k 64 \
  --max_tasks 20
Resources
Citation
@article{barnes2026surprisal,
  title={Surprisal-Guided Selection: Compute-Optimal Test-Time Strategies for Execution-Grounded Code Generation},
  author={Barnes, Jarrod},
  journal={arXiv preprint arXiv:2602.07670},
  year={2026},
  url={http://arxiv.org/abs/2602.07670}
}
The question I started with was where to spend additional compute. On these KernelBench comparisons, sampling preserved useful alternatives that the short adaptation runs did not reliably improve. The cause of that adaptation failure remains less certain than the performance result.
My practical starting point is to sample, evaluate correctness, and compare selectors at the same budget. Surprisal was useful on the diverse five-task subset, but its signal weakened when candidates were nearly identical. The result depends on that variation, on the verifier, and on the cost already paid to evaluate the candidate pool.